Danh mục: Tin tức
Bài viết gần đây
-
-
Nhật ký vận hành Bot MT5: mẫu 7 ngày & khi nào phải dừng bot
Tháng 8 1, 2026 -
Cài MT5 trên VPS từ A→Z & giữ Terminal sống sau khi đóng RDP
Tháng 8 1, 2026
| Chiến lược RSI trong Bot Auto Trading: Thế nào là hiệu quả?
Được viết bởi thanhdt vào ngày 16/11/2025 lúc 20:53 | 207 lượt xem

Chiến lược RSI trong Bot Auto Trading: Thế nào là hiệu quả?
RSI (Relative Strength Index) là một trong những chỉ báo kỹ thuật phổ biến nhất trong trading. Tuy nhiên, không phải mọi chiến lược RSI đều hiệu quả. Trong bài viết này, chúng ta sẽ tìm hiểu các chiến lược RSI thực sự hiệu quả cho bot auto trading và cách triển khai chúng bằng Python.
1. Hiểu về RSI
RSI là chỉ báo động lượng đo lường tốc độ và độ lớn của biến động giá. RSI dao động từ 0 đến 100:
- RSI < 30: Vùng oversold (quá bán) – có thể tăng giá
- RSI > 70: Vùng overbought (quá mua) – có thể giảm giá
- RSI 30-70: Vùng trung tính
Công thức tính RSI
import pandas as pd
import numpy as np

def calculate_rsi(prices, period=14):
    """
    Tính toán RSI (Relative Strength Index)

    Parameters:
    -----------
    prices : pd.Series
        Chuỗi giá đóng cửa
    period : int
        Chu kỳ tính toán (mặc định 14)

    Returns:
    --------
    pd.Series
        Giá trị RSI
    """
    delta = prices.diff()

    # Tách gain và loss
    gain = (delta.where(delta > 0, 0)).rolling(window=period).mean()
    loss = (-delta.where(delta < 0, 0)).rolling(window=period).mean()

    # Tính RS và RSI
    rs = gain / loss
    rsi = 100 - (100 / (1 + rs))

    return rsi
2. Các chiến lược RSI hiệu quả
2.1. Chiến lược RSI Cơ bản (Oversold/Overbought)
Đặc điểm:
- Đơn giản, dễ triển khai
- Phù hợp với thị trường có xu hướng rõ ràng
- Cần kết hợp với xác nhận từ chỉ báo khác
Quy tắc:
- Mua: RSI < 30 (oversold) và bắt đầu tăng
- Bán: RSI > 70 (overbought) và bắt đầu giảm
class BasicRSIStrategy:
    """Chiến lược RSI cơ bản"""

    def __init__(self, rsi_period=14, oversold=30, overbought=70):
        self.rsi_period = rsi_period
        self.oversold = oversold
        self.overbought = overbought

    def calculate_rsi(self, prices):
        """Tính RSI"""
        delta = prices.diff()
        gain = (delta.where(delta > 0, 0)).rolling(window=self.rsi_period).mean()
        loss = (-delta.where(delta < 0, 0)).rolling(window=self.rsi_period).mean()
        rs = gain / loss
        rsi = 100 - (100 / (1 + rs))
        return rsi

    def generate_signals(self, df):
        """
        Tạo tín hiệu giao dịch

        Returns:
        --------
        pd.Series: 1 = Mua, -1 = Bán, 0 = Giữ
        """
        df['RSI'] = self.calculate_rsi(df['Close'])
        df['Signal'] = 0

        # Tín hiệu mua: RSI vượt lên từ dưới 30
        df.loc[(df['RSI'] < self.oversold) &
               (df['RSI'].shift(1) >= self.oversold), 'Signal'] = 1

        # Tín hiệu bán: RSI giảm xuống từ trên 70
        df.loc[(df['RSI'] > self.overbought) &
               (df['RSI'].shift(1) <= self.overbought), 'Signal'] = -1

        return df['Signal']
2.2. Chiến lược RSI + Moving Average (Hiệu quả cao)
Đặc điểm:
- Kết hợp RSI với Moving Average để lọc tín hiệu
- Giảm false signals đáng kể
- Phù hợp với nhiều loại thị trường
Quy tắc:
- Mua: RSI < 30 VÀ giá > MA (xu hướng tăng)
- Bán: RSI > 70 VÀ giá < MA (xu hướng giảm)
class RSIWithMAStrategy:
    """Chiến lược RSI kết hợp Moving Average"""

    def __init__(self, rsi_period=14, ma_period=50, oversold=30, overbought=70):
        self.rsi_period = rsi_period
        self.ma_period = ma_period
        self.oversold = oversold
        self.overbought = overbought

    def calculate_indicators(self, df):
        """Tính toán các chỉ báo"""
        # RSI
        delta = df['Close'].diff()
        gain = (delta.where(delta > 0, 0)).rolling(window=self.rsi_period).mean()
        loss = (-delta.where(delta < 0, 0)).rolling(window=self.rsi_period).mean()
        rs = gain / loss
        df['RSI'] = 100 - (100 / (1 + rs))

        # Moving Average
        df['MA'] = df['Close'].rolling(window=self.ma_period).mean()

        return df

    def generate_signals(self, df):
        """Tạo tín hiệu giao dịch"""
        df = self.calculate_indicators(df)
        df['Signal'] = 0

        # Tín hiệu mua: RSI oversold + giá trên MA (uptrend)
        buy_condition = (
            (df['RSI'] < self.oversold) &
            (df['Close'] > df['MA']) &
            (df['RSI'].shift(1) >= self.oversold)  # RSI vừa vượt lên
        )
        df.loc[buy_condition, 'Signal'] = 1

        # Tín hiệu bán: RSI overbought + giá dưới MA (downtrend)
        sell_condition = (
            (df['RSI'] > self.overbought) &
            (df['Close'] < df['MA']) &
            (df['RSI'].shift(1) <= self.overbought)  # RSI vừa giảm xuống
        )
        df.loc[sell_condition, 'Signal'] = -1

        return df['Signal']
2.3. Chiến lược RSI Divergence (Nâng cao – Rất hiệu quả)
Đặc điểm:
- Phát hiện sự phân kỳ giữa giá và RSI
- Tín hiệu mạnh, độ chính xác cao
- Phù hợp để phát hiện đảo chiều xu hướng
Quy tắc:
- Bullish Divergence: Giá tạo lower low, RSI tạo higher low → Tín hiệu mua
- Bearish Divergence: Giá tạo higher high, RSI tạo lower high → Tín hiệu bán
class RSIDivergenceStrategy:
    """Chiến lược RSI Divergence"""

    def __init__(self, rsi_period=14, lookback=5):
        self.rsi_period = rsi_period
        self.lookback = lookback

    def find_peaks_troughs(self, series):
        """Tìm đỉnh và đáy trong chuỗi"""
        from scipy.signal import find_peaks

        # Tìm đỉnh
        peaks, _ = find_peaks(series, distance=self.lookback)

        # Tìm đáy
        troughs, _ = find_peaks(-series, distance=self.lookback)

        return peaks, troughs

    def detect_divergence(self, prices, rsi):
        """Phát hiện divergence"""
        signals = pd.Series(0, index=prices.index)

        # Tìm đỉnh và đáy của giá
        price_peaks, price_troughs = self.find_peaks_troughs(prices.values)
        rsi_peaks, rsi_troughs = self.find_peaks_troughs(rsi.values)

        # Bullish Divergence: Giá tạo lower low, RSI tạo higher low
        if len(price_troughs) >= 2 and len(rsi_troughs) >= 2:
            price_low1 = prices.iloc[price_troughs[-2]]
            price_low2 = prices.iloc[price_troughs[-1]]
            rsi_low1 = rsi.iloc[rsi_troughs[-2]]
            rsi_low2 = rsi.iloc[rsi_troughs[-1]]

            if price_low2 < price_low1 and rsi_low2 > rsi_low1:
                signals.iloc[price_troughs[-1]] = 1  # Tín hiệu mua

        # Bearish Divergence: Giá tạo higher high, RSI tạo lower high
        if len(price_peaks) >= 2 and len(rsi_peaks) >= 2:
            price_high1 = prices.iloc[price_peaks[-2]]
            price_high2 = prices.iloc[price_peaks[-1]]
            rsi_high1 = rsi.iloc[rsi_peaks[-2]]
            rsi_high2 = rsi.iloc[rsi_peaks[-1]]

            if price_high2 > price_high1 and rsi_high2 < rsi_high1:
                signals.iloc[price_peaks[-1]] = -1  # Tín hiệu bán

        return signals

    def generate_signals(self, df):
        """Tạo tín hiệu từ divergence"""
        # Tính RSI
        delta = df['Close'].diff()
        gain = (delta.where(delta > 0, 0)).rolling(window=self.rsi_period).mean()
        loss = (-delta.where(delta < 0, 0)).rolling(window=self.rsi_period).mean()
        rs = gain / loss
        df['RSI'] = 100 - (100 / (1 + rs))

        # Phát hiện divergence
        signals = self.detect_divergence(df['Close'], df['RSI'])

        return signals
2.4. Chiến lược RSI với Multiple Timeframes (Rất hiệu quả)
Đặc điểm:
- Phân tích RSI trên nhiều khung thời gian
- Tín hiệu mạnh và đáng tin cậy hơn
- Phù hợp cho swing trading và position trading
Quy tắc:
- Mua: RSI(1h) < 30, RSI(4h) < 50, RSI(1d) > 50 (xu hướng tăng dài hạn)
- Bán: RSI(1h) > 70, RSI(4h) > 50, RSI(1d) < 50 (xu hướng giảm dài hạn)
class MultiTimeframeRSIStrategy:
    """Chiến lược RSI đa khung thời gian"""

    def __init__(self, rsi_period=14):
        self.rsi_period = rsi_period

    def calculate_rsi(self, prices):
        """Tính RSI"""
        delta = prices.diff()
        gain = (delta.where(delta > 0, 0)).rolling(window=self.rsi_period).mean()
        loss = (-delta.where(delta < 0, 0)).rolling(window=self.rsi_period).mean()
        rs = gain / loss
        return 100 - (100 / (1 + rs))

    def analyze_multiple_timeframes(self, exchange, symbol):
        """
        Phân tích RSI trên nhiều khung thời gian

        Parameters:
        -----------
        exchange : ccxt.Exchange
            Exchange object
        symbol : str
            Trading pair (e.g., 'BTC/USDT')

        Returns:
        --------
        dict: RSI values cho các timeframe
        """
        timeframes = {
            '1h': '1h',
            '4h': '4h',
            '1d': '1d'
        }

        rsi_values = {}

        for tf_name, tf_code in timeframes.items():
            # Lấy dữ liệu OHLCV
            ohlcv = exchange.fetch_ohlcv(symbol, tf_code, limit=100)
            df = pd.DataFrame(ohlcv, columns=['timestamp', 'open', 'high', 'low', 'close', 'volume'])
            df['timestamp'] = pd.to_datetime(df['timestamp'], unit='ms')

            # Tính RSI
            rsi = self.calculate_rsi(df['close'])
            rsi_values[tf_name] = rsi.iloc[-1]

        return rsi_values

    def generate_signals(self, rsi_values):
        """
        Tạo tín hiệu từ RSI đa khung thời gian

        Returns:
        --------
        int: 1 = Mua, -1 = Bán, 0 = Giữ
        """
        rsi_1h = rsi_values['1h']
        rsi_4h = rsi_values['4h']
        rsi_1d = rsi_values['1d']

        # Tín hiệu mua: RSI ngắn hạn oversold, dài hạn trong xu hướng tăng
        if rsi_1h < 30 and rsi_4h < 50 and rsi_1d > 50:
            return 1

        # Tín hiệu bán: RSI ngắn hạn overbought, dài hạn trong xu hướng giảm
        if rsi_1h > 70 and rsi_4h > 50 and rsi_1d < 50:
            return -1

        return 0
3. Bot Auto Trading với RSI Strategy
3.1. Cấu trúc Bot hoàn chỉnh
import ccxt
import pandas as pd
import numpy as np
import time
from datetime import datetime
from typing import Dict, Optional

class RSITradingBot:
    """Bot auto trading sử dụng chiến lược RSI"""

    def __init__(self, exchange_name: str, api_key: str, api_secret: str,
                 strategy_type: str = 'rsi_ma'):
        """
        Khởi tạo bot

        Parameters:
        -----------
        exchange_name : str
            Tên sàn (binance, coinbase, etc.)
        api_key : str
            API key
        api_secret : str
            API secret
        strategy_type : str
            Loại chiến lược ('basic', 'rsi_ma', 'divergence', 'multi_tf')
        """
        # Kết nối exchange
        exchange_class = getattr(ccxt, exchange_name)
        self.exchange = exchange_class({
            'apiKey': api_key,
            'secret': api_secret,
            'enableRateLimit': True,
        })

        # Chọn chiến lược
        self.strategy = self._init_strategy(strategy_type)

        # Quản lý vị thế
        self.position = None
        self.entry_price = None
        self.stop_loss = None
        self.take_profit = None

        # Cài đặt rủi ro
        self.max_position_size = 0.1  # 10% vốn
        self.stop_loss_pct = 0.02  # 2%
        self.take_profit_pct = 0.04  # 4%

    def _init_strategy(self, strategy_type: str):
        """Khởi tạo chiến lược"""
        if strategy_type == 'basic':
            return BasicRSIStrategy()
        elif strategy_type == 'rsi_ma':
            return RSIWithMAStrategy()
        elif strategy_type == 'divergence':
            return RSIDivergenceStrategy()
        elif strategy_type == 'multi_tf':
            return MultiTimeframeRSIStrategy()
        else:
            raise ValueError(f"Unknown strategy type: {strategy_type}")

    def get_market_data(self, symbol: str, timeframe: str = '1h', limit: int = 100):
        """Lấy dữ liệu thị trường"""
        ohlcv = self.exchange.fetch_ohlcv(symbol, timeframe, limit=limit)
        df = pd.DataFrame(ohlcv, columns=['timestamp', 'open', 'high', 'low', 'close', 'volume'])
        df['timestamp'] = pd.to_datetime(df['timestamp'], unit='ms')
        df.set_index('timestamp', inplace=True)
        return df

    def calculate_position_size(self, balance: float, price: float) -> float:
        """Tính toán kích thước vị thế"""
        max_position_value = balance * self.max_position_size
        position_size = max_position_value / price
        return position_size

    def place_order(self, symbol: str, side: str, amount: float,
                   order_type: str = 'market'):
        """Đặt lệnh giao dịch"""
        try:
            if side == 'buy':
                order = self.exchange.create_market_buy_order(symbol, amount)
            else:
                order = self.exchange.create_market_sell_order(symbol, amount)

            print(f"[{datetime.now()}] {side.upper()} {amount} {symbol} @ {order['price']}")
            return order
        except Exception as e:
            print(f"Error placing order: {e}")
            return None

    def check_stop_loss_take_profit(self, current_price: float):
        """Kiểm tra stop loss và take profit"""
        if self.position is None:
            return

        if self.position == 'long':
            # Kiểm tra stop loss
            if current_price <= self.stop_loss:
                print(f"[{datetime.now()}] Stop Loss triggered @ {current_price}")
                self.close_position(current_price)
                return

            # Kiểm tra take profit
            if current_price >= self.take_profit:
                print(f"[{datetime.now()}] Take Profit triggered @ {current_price}")
                self.close_position(current_price)
                return

    def open_position(self, symbol: str, side: str, price: float, amount: float):
        """Mở vị thế"""
        order = self.place_order(symbol, side, amount)
        if order:
            self.position = side
            self.entry_price = price

            # Đặt stop loss và take profit
            if side == 'long':
                self.stop_loss = price * (1 - self.stop_loss_pct)
                self.take_profit = price * (1 + self.take_profit_pct)

            print(f"[{datetime.now()}] Position opened: {side} @ {price}")

    def close_position(self, price: float):
        """Đóng vị thế"""
        if self.position:
            # Tính toán lợi nhuận
            if self.position == 'long':
                pnl_pct = ((price - self.entry_price) / self.entry_price) * 100
                print(f"[{datetime.now()}] Position closed. P&L: {pnl_pct:.2f}%")

            self.position = None
            self.entry_price = None
            self.stop_loss = None
            self.take_profit = None

    def run(self, symbol: str, timeframe: str = '1h', check_interval: int = 300):
        """
        Chạy bot

        Parameters:
        -----------
        symbol : str
            Trading pair
        timeframe : str
            Khung thời gian
        check_interval : int
            Thời gian chờ giữa các lần kiểm tra (giây)
        """
        print(f"[{datetime.now()}] Bot started for {symbol}")

        while True:
            try:
                # Lấy dữ liệu thị trường
                df = self.get_market_data(symbol, timeframe)
                current_price = df['close'].iloc[-1]

                # Kiểm tra stop loss và take profit
                if self.position:
                    self.check_stop_loss_take_profit(current_price)
                    if self.position is None:  # Đã đóng vị thế
                        time.sleep(check_interval)
                        continue

                # Tạo tín hiệu
                if isinstance(self.strategy, MultiTimeframeRSIStrategy):
                    rsi_values = self.strategy.analyze_multiple_timeframes(
                        self.exchange, symbol
                    )
                    signal = self.strategy.generate_signals(rsi_values)
                else:
                    signals = self.strategy.generate_signals(df)
                    signal = signals.iloc[-1]

                # Xử lý tín hiệu
                if signal == 1 and self.position != 'long':
                    # Tín hiệu mua
                    balance = self.exchange.fetch_balance()
                    available_balance = balance['USDT']['free'] if 'USDT' in balance else balance['total']['USDT']
                    amount = self.calculate_position_size(available_balance, current_price)

                    if amount > 0:
                        self.open_position(symbol, 'long', current_price, amount)

                elif signal == -1 and self.position == 'long':
                    # Tín hiệu bán
                    self.close_position(current_price)

                # Đợi đến lần kiểm tra tiếp theo
                time.sleep(check_interval)

            except KeyboardInterrupt:
                print(f"[{datetime.now()}] Bot stopped by user")
                break
            except Exception as e:
                print(f"[{datetime.now()}] Error: {e}")
                time.sleep(check_interval)
4. Backtesting Chiến lược RSI
4.1. Hàm Backtest
def backtest_rsi_strategy(df, strategy, initial_capital=10000):
    """
    Backtest chiến lược RSI

    Parameters:
    -----------
    df : pd.DataFrame
        Dữ liệu OHLCV
    strategy : Strategy object
        Đối tượng chiến lược
    initial_capital : float
        Vốn ban đầu

    Returns:
    --------
    dict: Kết quả backtest
    """
    # Tạo tín hiệu
    signals = strategy.generate_signals(df.copy())
    df['Signal'] = signals

    # Tính toán vị thế và lợi nhuận
    capital = initial_capital
    position = 0
    entry_price = 0
    trades = []

    for i in range(len(df)):
        price = df['close'].iloc[i]
        signal = df['Signal'].iloc[i]

        if signal == 1 and position == 0:  # Mua
            position = capital / price
            entry_price = price
            trades.append({
                'type': 'buy',
                'date': df.index[i],
                'price': price,
                'capital': capital
            })

        elif signal == -1 and position > 0:  # Bán
            capital = position * price
            pnl = ((price - entry_price) / entry_price) * 100
            trades.append({
                'type': 'sell',
                'date': df.index[i],
                'price': price,
                'capital': capital,
                'pnl': pnl
            })
            position = 0

    # Tính toán metrics
    if position > 0:  # Đóng vị thế cuối cùng
        final_price = df['close'].iloc[-1]
        capital = position * final_price

    total_return = ((capital - initial_capital) / initial_capital) * 100
    winning_trades = [t for t in trades if t.get('pnl', 0) > 0]
    losing_trades = [t for t in trades if t.get('pnl', 0) < 0]

    win_rate = len(winning_trades) / len([t for t in trades if 'pnl' in t]) * 100 if trades else 0
    avg_win = np.mean([t['pnl'] for t in winning_trades]) if winning_trades else 0
    avg_loss = np.mean([t['pnl'] for t in losing_trades]) if losing_trades else 0

    return {
        'initial_capital': initial_capital,
        'final_capital': capital,
        'total_return': total_return,
        'total_trades': len([t for t in trades if 'pnl' in t]),
        'winning_trades': len(winning_trades),
        'losing_trades': len(losing_trades),
        'win_rate': win_rate,
        'avg_win': avg_win,
        'avg_loss': avg_loss,
        'profit_factor': abs(avg_win / avg_loss) if avg_loss != 0 else 0,
        'trades': trades
    }

# Ví dụ sử dụng
import yfinance as yf

# Lấy dữ liệu
data = yf.download('BTC-USD', period='1y', interval='1h')
df = pd.DataFrame(data)
df.columns = [col.lower() for col in df.columns]

# Chạy backtest
strategy = RSIWithMAStrategy(rsi_period=14, ma_period=50)
results = backtest_rsi_strategy(df, strategy, initial_capital=10000)

print(f"Total Return: {results['total_return']:.2f}%")
print(f"Win Rate: {results['win_rate']:.2f}%")
print(f"Total Trades: {results['total_trades']}")
print(f"Profit Factor: {results['profit_factor']:.2f}")
5. Tối ưu hóa tham số RSI
5.1. Tìm tham số tối ưu
from itertools import product

def optimize_rsi_parameters(df, strategy_class, param_ranges):
    """
    Tối ưu hóa tham số RSI

    Parameters:
    -----------
    df : pd.DataFrame
        Dữ liệu lịch sử
    strategy_class : class
        Lớp chiến lược
    param_ranges : dict
        Phạm vi tham số cần tối ưu

    Returns:
    --------
    dict: Tham số tối ưu và kết quả
    """
    best_params = None
    best_return = -float('inf')
    best_results = None

    # Tạo tất cả các tổ hợp tham số
    param_names = list(param_ranges.keys())
    param_values = list(param_ranges.values())

    for params in product(*param_values):
        param_dict = dict(zip(param_names, params))

        # Tạo chiến lược với tham số mới
        strategy = strategy_class(**param_dict)

        # Backtest
        results = backtest_rsi_strategy(df, strategy)

        # Đánh giá (có thể dùng Sharpe ratio, total return, etc.)
        score = results['total_return'] * (results['win_rate'] / 100)

        if score > best_return:
            best_return = score
            best_params = param_dict
            best_results = results

    return {
        'best_params': best_params,
        'best_return': best_return,
        'results': best_results
    }

# Ví dụ tối ưu hóa
param_ranges = {
    'rsi_period': [10, 14, 21],
    'ma_period': [20, 50, 100],
    'oversold': [25, 30, 35],
    'overbought': [65, 70, 75]
}

optimization_results = optimize_rsi_parameters(df, RSIWithMAStrategy, param_ranges)
print("Best Parameters:", optimization_results['best_params'])
print("Best Return:", optimization_results['best_return'])
6. Quản lý rủi ro với RSI
6.1. Position Sizing động
class RiskManager:
    """Quản lý rủi ro cho chiến lược RSI"""

    def __init__(self, max_risk_per_trade=0.02, max_portfolio_risk=0.1):
        self.max_risk_per_trade = max_risk_per_trade
        self.max_portfolio_risk = max_portfolio_risk

    def calculate_position_size(self, account_balance, entry_price, stop_loss_price):
        """
        Tính toán kích thước vị thế dựa trên rủi ro

        Parameters:
        -----------
        account_balance : float
            Số dư tài khoản
        entry_price : float
            Giá vào lệnh
        stop_loss_price : float
            Giá stop loss

        Returns:
        --------
        float: Kích thước vị thế
        """
        risk_amount = account_balance * self.max_risk_per_trade
        price_risk = abs(entry_price - stop_loss_price)

        if price_risk == 0:
            return 0

        position_size = risk_amount / price_risk
        return position_size

    def adjust_stop_loss_by_volatility(self, entry_price, rsi, atr):
        """
        Điều chỉnh stop loss dựa trên volatility

        Parameters:
        -----------
        entry_price : float
            Giá vào lệnh
        rsi : float
            Giá trị RSI hiện tại
        atr : float
            Average True Range (đo lường volatility)

        Returns:
        --------
        float: Giá stop loss
        """
        # RSI càng cực đoan, stop loss càng rộng (volatility cao)
        if rsi < 20 or rsi > 80:
            stop_loss_multiplier = 2.0
        elif rsi < 30 or rsi > 70:
            stop_loss_multiplier = 1.5
        else:
            stop_loss_multiplier = 1.0

        stop_loss = entry_price - (atr * stop_loss_multiplier)
        return stop_loss
7. Kết luận: Chiến lược RSI nào hiệu quả nhất?
Đánh giá các chiến lược:
- RSI Cơ bản (Oversold/Overbought)
- ✅ Đơn giản, dễ triển khai
- ❌ Nhiều false signals
- ⭐ Hiệu quả: 3/5
- RSI + Moving Average
- ✅ Giảm false signals đáng kể
- ✅ Phù hợp nhiều thị trường
- ⭐ Hiệu quả: 4/5
- RSI Divergence
- ✅ Tín hiệu mạnh, độ chính xác cao
- ❌ Khó phát hiện, ít tín hiệu
- ⭐ Hiệu quả: 4.5/5
- RSI Multi-Timeframe
- ✅ Tín hiệu đáng tin cậy nhất
- ✅ Phù hợp swing/position trading
- ⭐ Hiệu quả: 5/5
Khuyến nghị:
- Cho người mới bắt đầu: RSI + MA Strategy
- Cho trader có kinh nghiệm: Multi-Timeframe RSI
- Cho scalping: RSI Divergence với khung thời gian ngắn
Lưu ý quan trọng:
- Không bao giờ trade chỉ dựa vào RSI: Luôn kết hợp với các chỉ báo khác
- Quản lý rủi ro: Luôn đặt stop loss và take profit
- Backtest trước: Kiểm tra chiến lược trên dữ liệu lịch sử
- Tối ưu hóa tham số: Tìm tham số phù hợp với từng thị trường
- Theo dõi và điều chỉnh: Thị trường thay đổi, chiến lược cũng cần thay đổi
8. Tài liệu tham khảo
- RSI Indicator – Investopedia
- Technical Analysis of the Financial Markets – John J. Murphy
- Python for Finance – Yves Hilpisch
Lưu ý: Trading có rủi ro. Hãy luôn backtest kỹ lưỡng và bắt đầu với số vốn nhỏ. Bài viết này chỉ mang tính chất giáo dục, không phải lời khuyên đầu tư.
Bài viết gần đây
-
Bot Auto Trading là gì? Hướng dẫn xây dựng bot thực chiến 2026
Tháng 8 2, 2026 -
Nhật ký vận hành Bot MT5: mẫu 7 ngày & khi nào phải dừng bot
Tháng 8 1, 2026 -
Cài MT5 trên VPS từ A→Z & giữ Terminal sống sau khi đóng RDP
Tháng 8 1, 2026
| Chiến Lược Phân Kỳ Hội Tụ (MACD) trong Bot Auto Trading Forex với Python
Được viết bởi thanhdt vào ngày 16/11/2025 lúc 20:46 | 324 lượt xem

Chiến Lược Phân Kỳ Hội Tụ (MACD) trong Bot Auto Trading Forex với Python
MACD (Moving Average Convergence Divergence) là một trong những chỉ báo kỹ thuật phổ biến nhất trong phân tích kỹ thuật Forex. Trong bài viết này, chúng ta sẽ tìm hiểu cách xây dựng bot giao dịch tự động sử dụng chiến lược MACD với Python.
Tổng quan về MACD
MACD là gì?
MACD là một chỉ báo động lượng theo xu hướng, được phát triển bởi Gerald Appel vào cuối những năm 1970. Chỉ báo này đo lường mối quan hệ giữa hai đường trung bình động (Moving Averages) của giá.
Các thành phần của MACD
MACD bao gồm 3 thành phần chính:
- Đường MACD (MACD Line): Chênh lệch giữa EMA 12 và EMA 26
- Đường Signal (Signal Line): EMA 9 của đường MACD
- Histogram: Chênh lệch giữa đường MACD và đường Signal
# Công thức tính MACD
MACD Line = EMA(12) - EMA(26)
Signal Line = EMA(9) của MACD Line
Histogram = MACD Line - Signal Line
Cài đặt môi trường
Thư viện cần thiết
# requirements.txt
pandas==2.1.0
numpy==1.24.3
ccxt==4.0.0
ta-lib==0.4.28
matplotlib==3.7.2
python-binance==1.0.19
Cài đặt
pip install pandas numpy ccxt ta-lib matplotlib python-binance
Lưu ý: TA-Lib yêu cầu cài đặt thư viện C trước. Trên Windows, tải file .whl từ đây.
Xây dựng chỉ báo MACD
Tính toán MACD từ đầu
import pandas as pd
import numpy as np
from typing import Tuple

class MACDIndicator:
    """
    Lớp tính toán chỉ báo MACD
    """

    def __init__(self, fast_period: int = 12, slow_period: int = 26, signal_period: int = 9):
        """
        Khởi tạo MACD Indicator

        Args:
            fast_period: Chu kỳ EMA nhanh (mặc định: 12)
            slow_period: Chu kỳ EMA chậm (mặc định: 26)
            signal_period: Chu kỳ EMA cho Signal Line (mặc định: 9)
        """
        self.fast_period = fast_period
        self.slow_period = slow_period
        self.signal_period = signal_period

    def calculate_ema(self, data: pd.Series, period: int) -> pd.Series:
        """
        Tính toán Exponential Moving Average (EMA)

        Args:
            data: Dữ liệu giá
            period: Chu kỳ EMA

        Returns:
            Series chứa giá trị EMA
        """
        return data.ewm(span=period, adjust=False).mean()

    def calculate(self, close_prices: pd.Series) -> pd.DataFrame:
        """
        Tính toán MACD, Signal và Histogram

        Args:
            close_prices: Series chứa giá đóng cửa

        Returns:
            DataFrame chứa MACD, Signal và Histogram
        """
        # Tính EMA nhanh và chậm
        ema_fast = self.calculate_ema(close_prices, self.fast_period)
        ema_slow = self.calculate_ema(close_prices, self.slow_period)

        # Tính đường MACD
        macd_line = ema_fast - ema_slow

        # Tính đường Signal
        signal_line = self.calculate_ema(macd_line, self.signal_period)

        # Tính Histogram
        histogram = macd_line - signal_line

        # Tạo DataFrame kết quả
        result = pd.DataFrame({
            'MACD': macd_line,
            'Signal': signal_line,
            'Histogram': histogram
        })

        return result
Sử dụng thư viện TA-Lib
import talib

def calculate_macd_talib(close_prices: np.array) -> Tuple[np.array, np.array, np.array]:
    """
    Tính MACD sử dụng TA-Lib

    Args:
        close_prices: Mảng giá đóng cửa

    Returns:
        Tuple (macd, signal, histogram)
    """
    macd, signal, histogram = talib.MACD(
        close_prices,
        fastperiod=12,
        slowperiod=26,
        signalperiod=9
    )

    return macd, signal, histogram
Chiến lược giao dịch MACD
1. Chiến lược giao cắt (Crossover Strategy)
Chiến lược cơ bản nhất: mua khi MACD cắt lên Signal, bán khi MACD cắt xuống Signal.
class MACDCrossoverStrategy:
    """
    Chiến lược giao dịch dựa trên giao cắt MACD và Signal
    """

    def __init__(self, macd_indicator: MACDIndicator):
        self.macd_indicator = macd_indicator
        self.position = None  # 'long', 'short', hoặc None

    def generate_signals(self, data: pd.DataFrame) -> pd.DataFrame:
        """
        Tạo tín hiệu giao dịch

        Args:
            data: DataFrame chứa dữ liệu giá OHLCV

        Returns:
            DataFrame với cột 'signal' (1: mua, -1: bán, 0: giữ)
        """
        # Tính MACD
        macd_data = self.macd_indicator.calculate(data['close'])

        # Khởi tạo cột signal
        signals = pd.DataFrame(index=data.index)
        signals['signal'] = 0
        signals['MACD'] = macd_data['MACD']
        signals['Signal'] = macd_data['Signal']
        signals['Histogram'] = macd_data['Histogram']

        # Tìm điểm giao cắt
        # MACD cắt lên Signal -> Tín hiệu mua
        signals.loc[
            (signals['MACD'] > signals['Signal']) &
            (signals['MACD'].shift(1) <= signals['Signal'].shift(1)),
            'signal'
        ] = 1

        # MACD cắt xuống Signal -> Tín hiệu bán
        signals.loc[
            (signals['MACD'] < signals['Signal']) &
            (signals['MACD'].shift(1) >= signals['Signal'].shift(1)),
            'signal'
        ] = -1

        return signals
2. Chiến lược Histogram
Sử dụng Histogram để xác định điểm vào lệnh sớm hơn.
class MACDHistogramStrategy:
    """
    Chiến lược dựa trên Histogram của MACD
    """

    def __init__(self, macd_indicator: MACDIndicator, threshold: float = 0.0001):
        self.macd_indicator = macd_indicator
        self.threshold = threshold  # Ngưỡng để xác nhận tín hiệu

    def generate_signals(self, data: pd.DataFrame) -> pd.DataFrame:
        """
        Tạo tín hiệu dựa trên Histogram
        """
        macd_data = self.macd_indicator.calculate(data['close'])

        signals = pd.DataFrame(index=data.index)
        signals['signal'] = 0
        signals['Histogram'] = macd_data['Histogram']
        signals['MACD'] = macd_data['MACD']
        signals['Signal'] = macd_data['Signal']

        # Tín hiệu mua: Histogram chuyển từ âm sang dương
        signals.loc[
            (signals['Histogram'] > 0) &
            (signals['Histogram'].shift(1) <= 0) &
            (signals['Histogram'] > self.threshold),
            'signal'
        ] = 1

        # Tín hiệu bán: Histogram chuyển từ dương sang âm
        signals.loc[
            (signals['Histogram'] < 0) &
            (signals['Histogram'].shift(1) >= 0) &
            (signals['Histogram'] < -self.threshold),
            'signal'
        ] = -1

        return signals
3. Chiến lược MACD với đường Zero
Kết hợp giao cắt với đường Zero để tăng độ chính xác.
class MACDZeroLineStrategy:
    """
    Chiến lược kết hợp giao cắt MACD/Signal và đường Zero
    """

    def __init__(self, macd_indicator: MACDIndicator):
        self.macd_indicator = macd_indicator

    def generate_signals(self, data: pd.DataFrame) -> pd.DataFrame:
        """
        Tạo tín hiệu với điều kiện MACD phải ở trên/dưới đường Zero
        """
        macd_data = self.macd_indicator.calculate(data['close'])

        signals = pd.DataFrame(index=data.index)
        signals['signal'] = 0
        signals['MACD'] = macd_data['MACD']
        signals['Signal'] = macd_data['Signal']
        signals['Histogram'] = macd_data['Histogram']

        # Tín hiệu mua: MACD cắt lên Signal VÀ MACD > 0
        buy_condition = (
            (signals['MACD'] > signals['Signal']) &
            (signals['MACD'].shift(1) <= signals['Signal'].shift(1)) &
            (signals['MACD'] > 0)
        )
        signals.loc[buy_condition, 'signal'] = 1

        # Tín hiệu bán: MACD cắt xuống Signal VÀ MACD < 0
        sell_condition = (
            (signals['MACD'] < signals['Signal']) &
            (signals['MACD'].shift(1) >= signals['Signal'].shift(1)) &
            (signals['MACD'] < 0)
        )
        signals.loc[sell_condition, 'signal'] = -1

        return signals
Xây dựng Bot Giao Dịch Forex
Lớp Forex Trading Bot
import ccxt
import time
import logging
from datetime import datetime
from typing import Optional, Dict

class ForexMACDBot:
    """
    Bot giao dịch Forex tự động sử dụng chiến lược MACD
    """

    def __init__(
        self,
        api_key: str,
        api_secret: str,
        exchange_name: str = 'binance',
        symbol: str = 'EUR/USDT',
        timeframe: str = '1h'
    ):
        """
        Khởi tạo bot

        Args:
            api_key: API key của sàn giao dịch
            api_secret: API secret của sàn giao dịch
            exchange_name: Tên sàn giao dịch (binance, oanda, etc.)
            symbol: Cặp tiền tệ (EUR/USDT, GBP/USD, etc.)
            timeframe: Khung thời gian ('1h', '4h', '1d')
        """
        self.api_key = api_key
        self.api_secret = api_secret
        self.symbol = symbol
        self.timeframe = timeframe

        # Khởi tạo exchange
        exchange_class = getattr(ccxt, exchange_name)
        self.exchange = exchange_class({
            'apiKey': self.api_key,
            'secret': self.api_secret,
            'enableRateLimit': True,
            'options': {
                'defaultType': 'spot'  # hoặc 'future' cho margin trading
            }
        })

        # Khởi tạo MACD indicator và strategy
        self.macd_indicator = MACDIndicator()
        self.strategy = MACDCrossoverStrategy(self.macd_indicator)

        # Quản lý vị thế
        self.position = None
        self.entry_price = None
        self.stop_loss = None
        self.take_profit = None

        # Cấu hình rủi ro
        self.risk_per_trade = 0.02  # 2% rủi ro mỗi lệnh
        self.stop_loss_pct = 0.02  # 2% stop loss
        self.take_profit_pct = 0.04  # 4% take profit

        # Logging
        logging.basicConfig(
            level=logging.INFO,
            format='%(asctime)s - %(levelname)s - %(message)s'
        )
        self.logger = logging.getLogger(__name__)

    def fetch_ohlcv_data(self, limit: int = 100) -> pd.DataFrame:
        """
        Lấy dữ liệu OHLCV từ sàn giao dịch

        Args:
            limit: Số lượng nến cần lấy

        Returns:
            DataFrame chứa dữ liệu OHLCV
        """
        try:
            ohlcv = self.exchange.fetch_ohlcv(
                self.symbol,
                self.timeframe,
                limit=limit
            )

            df = pd.DataFrame(
                ohlcv,
                columns=['timestamp', 'open', 'high', 'low', 'close', 'volume']
            )
            df['timestamp'] = pd.to_datetime(df['timestamp'], unit='ms')
            df.set_index('timestamp', inplace=True)

            return df

        except Exception as e:
            self.logger.error(f"Lỗi lấy dữ liệu: {str(e)}")
            return None

    def calculate_position_size(self, account_balance: float, entry_price: float) -> float:
        """
        Tính toán kích thước vị thế dựa trên rủi ro

        Args:
            account_balance: Số dư tài khoản
            entry_price: Giá vào lệnh

        Returns:
            Kích thước vị thế
        """
        risk_amount = account_balance * self.risk_per_trade
        stop_loss_distance = entry_price * self.stop_loss_pct

        if stop_loss_distance == 0:
            return 0

        position_size = risk_amount / stop_loss_distance

        return position_size

    def place_order(
        self,
        side: str,
        amount: float,
        order_type: str = 'market'
    ) -> Optional[Dict]:
        """
        Đặt lệnh giao dịch

        Args:
            side: 'buy' hoặc 'sell'
            amount: Số lượng
            order_type: Loại lệnh ('market', 'limit')

        Returns:
            Thông tin lệnh đã đặt
        """
        try:
            order = self.exchange.create_order(
                symbol=self.symbol,
                type=order_type,
                side=side,
                amount=amount
            )

            self.logger.info(f"Đã đặt lệnh {side.upper()}: {amount} {self.symbol}")
            return order

        except Exception as e:
            self.logger.error(f"Lỗi đặt lệnh: {str(e)}")
            return None

    def check_exit_conditions(self, current_price: float) -> bool:
        """
        Kiểm tra điều kiện thoát lệnh (stop loss, take profit)

        Args:
            current_price: Giá hiện tại

        Returns:
            True nếu cần thoát lệnh
        """
        if self.position is None:
            return False

        if self.position == 'long':
            # Kiểm tra stop loss
            if current_price <= self.stop_loss:
                self.logger.info(f"Kích hoạt Stop Loss tại {current_price}")
                return True

            # Kiểm tra take profit
            if current_price >= self.take_profit:
                self.logger.info(f"Kích hoạt Take Profit tại {current_price}")
                return True

        elif self.position == 'short':
            # Kiểm tra stop loss
            if current_price >= self.stop_loss:
                self.logger.info(f"Kích hoạt Stop Loss tại {current_price}")
                return True

            # Kiểm tra take profit
            if current_price <= self.take_profit:
                self.logger.info(f"Kích hoạt Take Profit tại {current_price}")
                return True

        return False

    def execute_trade(self, signal: int, current_price: float):
        """
        Thực hiện giao dịch dựa trên tín hiệu

        Args:
            signal: 1 (mua), -1 (bán), 0 (giữ)
            current_price: Giá hiện tại
        """
        # Kiểm tra điều kiện thoát lệnh trước
        if self.check_exit_conditions(current_price):
            self.close_position(current_price)
            return

        # Lấy số dư tài khoản
        try:
            balance = self.exchange.fetch_balance()
            account_balance = balance['total'].get('USDT', 0)
        except Exception as e:
            self.logger.error(f"Lỗi lấy số dư: {str(e)}")
            return

        # Xử lý tín hiệu mua
        if signal == 1 and self.position != 'long':
            # Đóng vị thế short nếu có
            if self.position == 'short':
                self.close_position(current_price)

            # Tính kích thước vị thế
            position_size = self.calculate_position_size(account_balance, current_price)

            if position_size > 0:
                # Đặt lệnh mua
                order = self.place_order('buy', position_size)

                if order:
                    self.position = 'long'
                    self.entry_price = current_price
                    self.stop_loss = current_price * (1 - self.stop_loss_pct)
                    self.take_profit = current_price * (1 + self.take_profit_pct)

                    self.logger.info(
                        f"Mở vị thế LONG: Entry={self.entry_price}, "
                        f"SL={self.stop_loss}, TP={self.take_profit}"
                    )

        # Xử lý tín hiệu bán
        elif signal == -1 and self.position != 'short':
            # Đóng vị thế long nếu có
            if self.position == 'long':
                self.close_position(current_price)

            # Tính kích thước vị thế
            position_size = self.calculate_position_size(account_balance, current_price)

            if position_size > 0:
                # Đặt lệnh bán
                order = self.place_order('sell', position_size)

                if order:
                    self.position = 'short'
                    self.entry_price = current_price
                    self.stop_loss = current_price * (1 + self.stop_loss_pct)
                    self.take_profit = current_price * (1 - self.take_profit_pct)

                    self.logger.info(
                        f"Mở vị thế SHORT: Entry={self.entry_price}, "
                        f"SL={self.stop_loss}, TP={self.take_profit}"
                    )

    def close_position(self, current_price: float):
        """
        Đóng vị thế hiện tại

        Args:
            current_price: Giá hiện tại
        """
        if self.position is None:
            return

        try:
            # Lấy số lượng vị thế hiện tại
            balance = self.exchange.fetch_balance()
            base_currency = self.symbol.split('/')[0]
            position_amount = balance['free'].get(base_currency, 0)

            if position_amount > 0:
                # Đóng lệnh
                if self.position == 'long':
                    self.place_order('sell', position_amount)
                else:
                    self.place_order('buy', position_amount)

                # Tính P&L
                if self.entry_price:
                    if self.position == 'long':
                        pnl_pct = ((current_price - self.entry_price) / self.entry_price) * 100
                    else:
                        pnl_pct = ((self.entry_price - current_price) / self.entry_price) * 100

                    self.logger.info(
                        f"Đóng vị thế {self.position.upper()}: "
                        f"Entry={self.entry_price}, Exit={current_price}, "
                        f"P&L={pnl_pct:.2f}%"
                    )

                # Reset vị thế
                self.position = None
                self.entry_price = None
                self.stop_loss = None
                self.take_profit = None

        except Exception as e:
            self.logger.error(f"Lỗi đóng vị thế: {str(e)}")

    def run(self):
        """
        Chạy bot giao dịch
        """
        self.logger.info(f"Khởi động bot giao dịch: {self.symbol}")

        while True:
            try:
                # Lấy dữ liệu thị trường
                data = self.fetch_ohlcv_data(limit=100)

                if data is None or len(data) < 50:
                    self.logger.warning("Không đủ dữ liệu, đợi chu kỳ tiếp theo...")
                    time.sleep(60)
                    continue

                # Tạo tín hiệu
                signals = self.strategy.generate_signals(data)
                latest_signal = signals['signal'].iloc[-1]
                current_price = data['close'].iloc[-1]

                # Thực hiện giao dịch
                if latest_signal != 0:
                    self.execute_trade(latest_signal, current_price)

                # Kiểm tra điều kiện thoát lệnh
                if self.position is not None:
                    self.check_exit_conditions(current_price)

                # Đợi đến chu kỳ tiếp theo
                time.sleep(60)  # Đợi 1 phút trước khi kiểm tra lại

            except KeyboardInterrupt:
                self.logger.info("Dừng bot theo yêu cầu người dùng")
                if self.position is not None:
                    data = self.fetch_ohlcv_data(limit=1)
                    if data is not None:
                        self.close_position(data['close'].iloc[-1])
                break

            except Exception as e:
                self.logger.error(f"Lỗi trong vòng lặp chính: {str(e)}")
                time.sleep(60)
Backtesting chiến lược MACD
Lớp Backtesting
class MACDBacktester:
    """
    Backtesting cho chiến lược MACD
    """

    def __init__(
        self,
        initial_capital: float = 10000,
        commission: float = 0.001  # 0.1% phí giao dịch
    ):
        self.initial_capital = initial_capital
        self.commission = commission
        self.capital = initial_capital
        self.position = None
        self.entry_price = None
        self.trades = []
        self.equity_curve = []

    def backtest(
        self,
        data: pd.DataFrame,
        strategy: MACDCrossoverStrategy
    ) -> pd.DataFrame:
        """
        Chạy backtest

        Args:
            data: Dữ liệu giá OHLCV
            strategy: Chiến lược giao dịch

        Returns:
            DataFrame chứa kết quả backtest
        """
        signals = strategy.generate_signals(data)

        results = data.copy()
        results['signal'] = signals['signal']
        results['MACD'] = signals['MACD']
        results['Signal'] = signals['Signal']
        results['position'] = 0
        results['capital'] = self.initial_capital
        results['returns'] = 0.0
        results['cumulative_returns'] = 0.0

        for i in range(1, len(results)):
            current_price = results['close'].iloc[i]
            signal = results['signal'].iloc[i]

            # Xử lý tín hiệu mua
            if signal == 1 and self.position != 'long':
                if self.position == 'short':
                    self._close_position(results, i, current_price)

                self.position = 'long'
                self.entry_price = current_price
                results.loc[results.index[i], 'position'] = 1

            # Xử lý tín hiệu bán
            elif signal == -1 and self.position != 'short':
                if self.position == 'long':
                    self._close_position(results, i, current_price)

                self.position = 'short'
                self.entry_price = current_price
                results.loc[results.index[i], 'position'] = -1

            # Tính toán lợi nhuận
            if self.position == 'long' and self.entry_price:
                pnl = ((current_price - self.entry_price) / self.entry_price) * self.capital
                results.loc[results.index[i], 'returns'] = pnl
            elif self.position == 'short' and self.entry_price:
                pnl = ((self.entry_price - current_price) / self.entry_price) * self.capital
                results.loc[results.index[i], 'returns'] = pnl

            # Tính cumulative returns
            results.loc[results.index[i], 'cumulative_returns'] = (
                results['returns'].iloc[:i+1].sum()
            )
            results.loc[results.index[i], 'capital'] = (
                self.initial_capital + results['cumulative_returns'].iloc[i]
            )

        # Đóng vị thế cuối cùng nếu còn
        if self.position is not None:
            self._close_position(results, len(results) - 1, results['close'].iloc[-1])

        return results

    def _close_position(self, results: pd.DataFrame, index: int, exit_price: float):
        """
        Đóng vị thế và tính P&L
        """
        if self.entry_price is None:
            return

        if self.position == 'long':
            pnl_pct = ((exit_price - self.entry_price) / self.entry_price) - self.commission
        else:
            pnl_pct = ((self.entry_price - exit_price) / self.entry_price) - self.commission

        pnl = pnl_pct * self.capital
        self.capital += pnl

        self.trades.append({
            'entry_time': results.index[index-1],
            'exit_time': results.index[index],
            'entry_price': self.entry_price,
            'exit_price': exit_price,
            'position': self.position,
            'pnl': pnl,
            'pnl_pct': pnl_pct * 100
        })

        self.position = None
        self.entry_price = None

    def calculate_metrics(self, results: pd.DataFrame) -> Dict:
        """
        Tính toán các chỉ số hiệu suất

        Args:
            results: Kết quả backtest

        Returns:
            Dictionary chứa các chỉ số
        """
        total_trades = len(self.trades)

        if total_trades == 0:
            return {
                'total_trades': 0,
                'win_rate': 0,
                'total_return': 0,
                'sharpe_ratio': 0
            }

        winning_trades = [t for t in self.trades if t['pnl'] > 0]
        losing_trades = [t for t in self.trades if t['pnl'] < 0]

        win_rate = len(winning_trades) / total_trades * 100

        total_return = ((self.capital - self.initial_capital) / self.initial_capital) * 100

        avg_win = np.mean([t['pnl'] for t in winning_trades]) if winning_trades else 0
        avg_loss = np.mean([t['pnl'] for t in losing_trades]) if losing_trades else 0

        profit_factor = abs(sum([t['pnl'] for t in winning_trades]) /
                          sum([t['pnl'] for t in losing_trades])) if losing_trades else 0

        # Tính Sharpe Ratio
        returns = results['returns'].dropna()
        if len(returns) > 0 and returns.std() > 0:
            sharpe_ratio = (returns.mean() / returns.std()) * np.sqrt(252)  # Annualized
        else:
            sharpe_ratio = 0

        # Maximum Drawdown
        cumulative = results['cumulative_returns']
        running_max = cumulative.expanding().max()
        drawdown = cumulative - running_max
        max_drawdown = drawdown.min()

        return {
            'total_trades': total_trades,
            'winning_trades': len(winning_trades),
            'losing_trades': len(losing_trades),
            'win_rate': win_rate,
            'total_return': total_return,
            'final_capital': self.capital,
            'avg_win': avg_win,
            'avg_loss': avg_loss,
            'profit_factor': profit_factor,
            'sharpe_ratio': sharpe_ratio,
            'max_drawdown': max_drawdown
        }
Ví dụ sử dụng Backtesting
# Ví dụ backtest
import yfinance as yf

# Lấy dữ liệu EUR/USD
data = yf.download('EURUSD=X', start='2023-01-01', end='2024-01-01', interval='1h')
data.columns = [col[0].lower() if isinstance(col, tuple) else col.lower()
                for col in data.columns]

# Chuẩn bị dữ liệu
data = data[['open', 'high', 'low', 'close', 'volume']].dropna()

# Khởi tạo strategy và backtester
macd_indicator = MACDIndicator()
strategy = MACDCrossoverStrategy(macd_indicator)
backtester = MACDBacktester(initial_capital=10000)

# Chạy backtest
results = backtester.backtest(data, strategy)

# Tính toán metrics
metrics = backtester.calculate_metrics(results)

print("=== Kết quả Backtest ===")
print(f"Tổng số lệnh: {metrics['total_trades']}")
print(f"Tỷ lệ thắng: {metrics['win_rate']:.2f}%")
print(f"Lợi nhuận tổng: {metrics['total_return']:.2f}%")
print(f"Sharpe Ratio: {metrics['sharpe_ratio']:.2f}")
print(f"Maximum Drawdown: {metrics['max_drawdown']:.2f}%")
print(f"Profit Factor: {metrics['profit_factor']:.2f}")
Tối ưu hóa tham số MACD
Grid Search để tìm tham số tối ưu
from itertools import product

class MACDOptimizer:
    """
    Tối ưu hóa tham số MACD
    """

    def __init__(self, data: pd.DataFrame):
        self.data = data
        self.best_params = None
        self.best_metrics = None

    def optimize(
        self,
        fast_range: range = range(8, 16),
        slow_range: range = range(20, 30),
        signal_range: range = range(6, 12)
    ) -> Dict:
        """
        Tìm tham số tối ưu bằng Grid Search

        Args:
            fast_range: Dải giá trị cho fast_period
            slow_range: Dải giá trị cho slow_period
            signal_range: Dải giá trị cho signal_period

        Returns:
            Dictionary chứa tham số tối ưu và metrics
        """
        best_sharpe = -np.inf
        best_params = None
        best_metrics = None

        total_combinations = len(list(product(fast_range, slow_range, signal_range)))
        print(f"Tổng số tổ hợp cần test: {total_combinations}")

        for fast, slow, signal in product(fast_range, slow_range, signal_range):
            if fast >= slow:
                continue

            try:
                # Khởi tạo indicator và strategy với tham số mới
                macd_indicator = MACDIndicator(
                    fast_period=fast,
                    slow_period=slow,
                    signal_period=signal
                )
                strategy = MACDCrossoverStrategy(macd_indicator)

                # Chạy backtest
                backtester = MACDBacktester(initial_capital=10000)
                results = backtester.backtest(self.data, strategy)
                metrics = backtester.calculate_metrics(results)

                # Đánh giá dựa trên Sharpe Ratio
                if metrics['sharpe_ratio'] > best_sharpe and metrics['total_trades'] > 10:
                    best_sharpe = metrics['sharpe_ratio']
                    best_params = {
                        'fast_period': fast,
                        'slow_period': slow,
                        'signal_period': signal
                    }
                    best_metrics = metrics

                    print(f"Tìm thấy tham số tốt hơn: {best_params}")
                    print(f"Sharpe Ratio: {best_sharpe:.2f}")

            except Exception as e:
                print(f"Lỗi với tham số ({fast}, {slow}, {signal}): {str(e)}")
                continue

        self.best_params = best_params
        self.best_metrics = best_metrics

        return {
            'best_params': best_params,
            'best_metrics': best_metrics
        }
Quản lý rủi ro nâng cao
Trailing Stop Loss
class TrailingStopLoss:
    """
    Trailing Stop Loss cho bot giao dịch
    """

    def __init__(self, trailing_pct: float = 0.02):
        """
        Args:
            trailing_pct: Phần trăm trailing stop (2% mặc định)
        """
        self.trailing_pct = trailing_pct
        self.highest_price = None  # Cho long position
        self.lowest_price = None   # Cho short position

    def update(self, current_price: float, position: str) -> Optional[float]:
        """
        Cập nhật trailing stop loss

        Args:
            current_price: Giá hiện tại
            position: 'long' hoặc 'short'

        Returns:
            Giá stop loss mới hoặc None
        """
        if position == 'long':
            if self.highest_price is None or current_price > self.highest_price:
                self.highest_price = current_price

            trailing_stop = self.highest_price * (1 - self.trailing_pct)
            return trailing_stop

        elif position == 'short':
            if self.lowest_price is None or current_price < self.lowest_price:
                self.lowest_price = current_price

            trailing_stop = self.lowest_price * (1 + self.trailing_pct)
            return trailing_stop

        return None
Position Sizing động
class DynamicPositionSizing:
    """
    Tính toán kích thước vị thế động dựa trên volatility
    """

    def __init__(self, base_risk: float = 0.02, lookback: int = 20):
        """
        Args:
            base_risk: Rủi ro cơ bản (2% mặc định)
            lookback: Số kỳ để tính volatility
        """
        self.base_risk = base_risk
        self.lookback = lookback

    def calculate_size(
        self,
        account_balance: float,
        entry_price: float,
        stop_loss_price: float,
        volatility: float
    ) -> float:
        """
        Tính kích thước vị thế dựa trên volatility

        Args:
            account_balance: Số dư tài khoản
            entry_price: Giá vào lệnh
            stop_loss_price: Giá stop loss
            volatility: Độ biến động (ATR hoặc std)

        Returns:
            Kích thước vị thế
        """
        # Điều chỉnh rủi ro dựa trên volatility
        # Volatility cao -> giảm kích thước vị thế
        volatility_factor = 1.0 / (1.0 + volatility)
        adjusted_risk = self.base_risk * volatility_factor

        # Tính kích thước vị thế
        risk_amount = account_balance * adjusted_risk
        stop_loss_distance = abs(entry_price - stop_loss_price)

        if stop_loss_distance == 0:
            return 0

        position_size = risk_amount / stop_loss_distance

        return position_size
Visualization và phân tích
Vẽ biểu đồ MACD
import matplotlib.pyplot as plt
import matplotlib.dates as mdates

def plot_macd_strategy(data: pd.DataFrame, signals: pd.DataFrame, results: pd.DataFrame = None):
    """
    Vẽ biểu đồ MACD và tín hiệu giao dịch

    Args:
        data: Dữ liệu giá
        signals: Tín hiệu giao dịch
        results: Kết quả backtest (optional)
    """
    fig, axes = plt.subplots(3, 1, figsize=(15, 12))

    # Biểu đồ giá
    ax1 = axes[0]
    ax1.plot(data.index, data['close'], label='Close Price', linewidth=1.5)

    # Đánh dấu điểm mua/bán
    buy_signals = signals[signals['signal'] == 1]
    sell_signals = signals[signals['signal'] == -1]

    ax1.scatter(buy_signals.index, data.loc[buy_signals.index, 'close'],
                color='green', marker='^', s=100, label='Buy Signal', zorder=5)
    ax1.scatter(sell_signals.index, data.loc[sell_signals.index, 'close'],
                color='red', marker='v', s=100, label='Sell Signal', zorder=5)

    ax1.set_title('Giá và Tín hiệu Giao dịch', fontsize=14, fontweight='bold')
    ax1.set_ylabel('Giá', fontsize=12)
    ax1.legend(loc='best')
    ax1.grid(True, alpha=0.3)

    # Biểu đồ MACD và Signal
    ax2 = axes[1]
    ax2.plot(signals.index, signals['MACD'], label='MACD', linewidth=1.5, color='blue')
    ax2.plot(signals.index, signals['Signal'], label='Signal', linewidth=1.5, color='red')
    ax2.axhline(y=0, color='black', linestyle='--', linewidth=0.5)
    ax2.set_title('MACD và Signal Line', fontsize=14, fontweight='bold')
    ax2.set_ylabel('MACD', fontsize=12)
    ax2.legend(loc='best')
    ax2.grid(True, alpha=0.3)

    # Biểu đồ Histogram
    ax3 = axes[2]
    colors = ['green' if x > 0 else 'red' for x in signals['Histogram']]
    ax3.bar(signals.index, signals['Histogram'], color=colors, alpha=0.6)
    ax3.axhline(y=0, color='black', linestyle='-', linewidth=0.5)
    ax3.set_title('MACD Histogram', fontsize=14, fontweight='bold')
    ax3.set_ylabel('Histogram', fontsize=12)
    ax3.set_xlabel('Thời gian', fontsize=12)
    ax3.grid(True, alpha=0.3)

    # Format x-axis
    for ax in axes:
        ax.xaxis.set_major_formatter(mdates.DateFormatter('%Y-%m-%d'))
        ax.xaxis.set_major_locator(mdates.DayLocator(interval=7))
        plt.setp(ax.xaxis.get_majorticklabels(), rotation=45)

    plt.tight_layout()
    plt.show()

    # Vẽ equity curve nếu có kết quả backtest
    if results is not None:
        fig, ax = plt.subplots(figsize=(15, 6))
        ax.plot(results.index, results['capital'], label='Equity Curve', linewidth=2)
        ax.axhline(y=backtester.initial_capital, color='red', linestyle='--',
                  label='Initial Capital', linewidth=1)
        ax.set_title('Equity Curve', fontsize=14, fontweight='bold')
        ax.set_ylabel('Vốn', fontsize=12)
        ax.set_xlabel('Thời gian', fontsize=12)
        ax.legend(loc='best')
        ax.grid(True, alpha=0.3)
        plt.tight_layout()
        plt.show()
Best Practices và Lưu ý
1. Kết hợp với các chỉ báo khác
MACD hoạt động tốt nhất khi kết hợp với các chỉ báo khác:
class EnhancedMACDStrategy:
    """
    Chiến lược MACD kết hợp với RSI và Volume
    """

    def __init__(self, macd_indicator: MACDIndicator):
        self.macd_indicator = macd_indicator

    def generate_signals(self, data: pd.DataFrame) -> pd.DataFrame:
        """
        Tạo tín hiệu với điều kiện bổ sung
        """
        # Tính MACD
        macd_data = self.macd_indicator.calculate(data['close'])

        # Tính RSI
        delta = data['close'].diff()
        gain = (delta.where(delta > 0, 0)).rolling(window=14).mean()
        loss = (-delta.where(delta < 0, 0)).rolling(window=14).mean()
        rs = gain / loss
        rsi = 100 - (100 / (1 + rs))

        signals = pd.DataFrame(index=data.index)
        signals['signal'] = 0
        signals['MACD'] = macd_data['MACD']
        signals['Signal'] = macd_data['Signal']
        signals['RSI'] = rsi

        # Tín hiệu mua: MACD cắt lên Signal VÀ RSI < 70 (không quá mua)
        buy_condition = (
            (signals['MACD'] > signals['Signal']) &
            (signals['MACD'].shift(1) <= signals['Signal'].shift(1)) &
            (signals['RSI'] < 70) &
            (signals['RSI'] > 30)  # Không quá bán
        )
        signals.loc[buy_condition, 'signal'] = 1

        # Tín hiệu bán: MACD cắt xuống Signal VÀ RSI > 30 (không quá bán)
        sell_condition = (
            (signals['MACD'] < signals['Signal']) &
            (signals['MACD'].shift(1) >= signals['Signal'].shift(1)) &
            (signals['RSI'] > 30) &
            (signals['RSI'] < 70)  # Không quá mua
        )
        signals.loc[sell_condition, 'signal'] = -1

        return signals
2. Quản lý thời gian giao dịch
from datetime import time

class TradingHoursFilter:
    """
    Lọc giao dịch theo giờ
    """

    def __init__(self, start_time: time, end_time: time):
        self.start_time = start_time
        self.end_time = end_time

    def is_trading_hours(self, timestamp: pd.Timestamp) -> bool:
        """
        Kiểm tra xem có trong giờ giao dịch không
        """
        current_time = timestamp.time()

        if self.start_time <= self.end_time:
            return self.start_time <= current_time <= self.end_time
        else:  # Qua đêm (ví dụ: 22:00 - 06:00)
            return current_time >= self.start_time or current_time <= self.end_time
3. Xử lý lỗi và logging
import logging
from logging.handlers import RotatingFileHandler

def setup_logging(log_file: str = 'forex_bot.log'):
    """
    Thiết lập logging cho bot
    """
    logger = logging.getLogger('ForexBot')
    logger.setLevel(logging.INFO)

    # File handler với rotation
    file_handler = RotatingFileHandler(
        log_file,
        maxBytes=10*1024*1024,  # 10MB
        backupCount=5
    )
    file_handler.setLevel(logging.INFO)

    # Console handler
    console_handler = logging.StreamHandler()
    console_handler.setLevel(logging.INFO)

    # Formatter
    formatter = logging.Formatter(
        '%(asctime)s - %(name)s - %(levelname)s - %(message)s'
    )
    file_handler.setFormatter(formatter)
    console_handler.setFormatter(formatter)

    logger.addHandler(file_handler)
    logger.addHandler(console_handler)

    return logger
Ví dụ hoàn chỉnh
Script chạy bot
# main.py
import os
from dotenv import load_dotenv

# Load environment variables
load_dotenv()

def main():
    # Cấu hình
    API_KEY = os.getenv('BINANCE_API_KEY')
    API_SECRET = os.getenv('BINANCE_API_SECRET')
    SYMBOL = 'EUR/USDT'
    TIMEFRAME = '1h'

    # Khởi tạo bot
    bot = ForexMACDBot(
        api_key=API_KEY,
        api_secret=API_SECRET,
        exchange_name='binance',
        symbol=SYMBOL,
        timeframe=TIMEFRAME
    )

    # Cấu hình rủi ro
    bot.risk_per_trade = 0.02  # 2% rủi ro mỗi lệnh
    bot.stop_loss_pct = 0.02   # 2% stop loss
    bot.take_profit_pct = 0.04  # 4% take profit (risk:reward = 1:2)

    # Chạy bot
    try:
        bot.run()
    except KeyboardInterrupt:
        print("\nĐang dừng bot...")
        if bot.position is not None:
            data = bot.fetch_ohlcv_data(limit=1)
            if data is not None:
                bot.close_position(data['close'].iloc[-1])

if __name__ == '__main__':
    main()
File .env
BINANCE_API_KEY=your_api_key_here
BINANCE_API_SECRET=your_api_secret_here
Kết luận
Chiến lược MACD là một công cụ mạnh mẽ trong giao dịch Forex tự động. Tuy nhiên, để đạt được hiệu quả tốt, bạn cần:
- Backtest kỹ lưỡng: Luôn test chiến lược trên dữ liệu lịch sử trước khi triển khai
- Quản lý rủi ro: Sử dụng stop loss và position sizing phù hợp
- Kết hợp nhiều chỉ báo: MACD hoạt động tốt hơn khi kết hợp với RSI, Volume, v.v.
- Tối ưu tham số: Tìm tham số MACD phù hợp với từng cặp tiền tệ
- Giám sát liên tục: Bot cần được theo dõi và điều chỉnh định kỳ
Lưu ý quan trọng: Giao dịch Forex có rủi ro cao. Luôn sử dụng số tiền bạn có thể chấp nhận mất và không bao giờ đầu tư quá khả năng tài chính của mình.
Tài liệu tham khảo
Bài viết gần đây
-
Bot Auto Trading là gì? Hướng dẫn xây dựng bot thực chiến 2026
Tháng 8 2, 2026 -
Nhật ký vận hành Bot MT5: mẫu 7 ngày & khi nào phải dừng bot
Tháng 8 1, 2026 -
Cài MT5 trên VPS từ A→Z & giữ Terminal sống sau khi đóng RDP
Tháng 8 1, 2026
| Tính toán chiến lược Buy/Sell Bot Auto Trading với DataFrame
Được viết bởi thanhdt vào ngày 16/11/2025 lúc 11:23 | 343 lượt xem

Tính toán chiến lược Buy/Sell Bot Auto Trading với DataFrame
Xây dựng bot giao dịch tự động đòi hỏi khả năng tính toán chính xác các tín hiệu mua/bán dựa trên dữ liệu thị trường. Với DataFrame trong Pandas, việc xử lý dữ liệu giá, tính toán chỉ báo kỹ thuật và tạo tín hiệu giao dịch trở nên đơn giản và hiệu quả. Bài viết này sẽ hướng dẫn bạn cách xây dựng một hệ thống tính toán chiến lược Buy/Sell hoàn chỉnh.
Tổng quan về Bot Auto Trading
Bot giao dịch tự động là chương trình máy tính thực hiện giao dịch dựa trên các quy tắc được lập trình sẵn. Các thành phần chính của một bot trading bao gồm:
- Thu thập dữ liệu: Lấy dữ liệu giá từ sàn giao dịch
- Tính toán chỉ báo: Tính các chỉ báo kỹ thuật (MA, RSI, MACD, v.v.)
- Tạo tín hiệu: Xác định điểm mua (Buy) và bán (Sell)
- Quản lý rủi ro: Đặt stop loss, take profit
- Thực thi lệnh: Gửi lệnh mua/bán tự động
Cài đặt thư viện cần thiết
import pandas as pd
import numpy as np
import yfinance as yf
import matplotlib.pyplot as plt
from datetime import datetime, timedelta
import warnings
warnings.filterwarnings('ignore')

# Thiết lập hiển thị
pd.set_option('display.max_columns', None)
pd.set_option('display.width', None)
Bước 1: Lấy và chuẩn bị dữ liệu
Lấy dữ liệu giá từ API
def get_price_data(symbol, period='1y', interval='1d'):
    """
    Lấy dữ liệu giá từ Yahoo Finance

    Parameters:
    symbol: Mã cổ phiếu/crypto (ví dụ: 'BTC-USD', 'AAPL')
    period: Khoảng thời gian ('1d', '5d', '1mo', '3mo', '6mo', '1y', '2y', '5y', '10y', 'ytd', 'max')
    interval: Khung thời gian ('1m', '2m', '5m', '15m', '30m', '60m', '90m', '1h', '1d', '5d', '1wk', '1mo', '3mo')
    """
    ticker = yf.Ticker(symbol)
    data = ticker.history(period=period, interval=interval)

    # Đảm bảo có đủ các cột cần thiết
    required_columns = ['Open', 'High', 'Low', 'Close', 'Volume']
    for col in required_columns:
        if col not in data.columns:
            raise ValueError(f"Thiếu cột {col} trong dữ liệu")

    # Đổi tên cột sang chữ thường để dễ làm việc
    data.columns = [col.lower() for col in data.columns]

    return data

# Lấy dữ liệu Bitcoin
df = get_price_data('BTC-USD', period='6mo', interval='1d')
print(f"Kích thước dữ liệu: {df.shape}")
print(df.head())
Làm sạch và chuẩn bị dữ liệu
def prepare_data(df):
    """
    Chuẩn bị và làm sạch dữ liệu
    """
    # Tạo bản sao để không ảnh hưởng dữ liệu gốc
    data = df.copy()

    # Xóa dữ liệu trùng lặp
    data = data.drop_duplicates()

    # Sắp xếp theo thời gian
    data = data.sort_index()

    # Xử lý giá trị thiếu
    data = data.fillna(method='ffill')  # Điền bằng giá trị trước đó

    # Đảm bảo giá trị hợp lệ (giá > 0)
    data = data[data['close'] > 0]
    data = data[data['volume'] >= 0]

    # Tính thêm các giá trị hữu ích
    data['returns'] = data['close'].pct_change()
    data['price_change'] = data['close'].diff()
    data['high_low_ratio'] = data['high'] / data['low']

    return data

# Chuẩn bị dữ liệu
df = prepare_data(df)
print(df.head())
Bước 2: Tính toán các chỉ báo kỹ thuật
Moving Average (Đường trung bình động)
def calculate_ma(data, period=20, ma_type='SMA'):
    """
    Tính đường trung bình động

    Parameters:
    data: Series hoặc DataFrame column
    period: Chu kỳ
    ma_type: Loại MA ('SMA', 'EMA', 'WMA')
    """
    if ma_type == 'SMA':
        return data.rolling(window=period).mean()
    elif ma_type == 'EMA':
        return data.ewm(span=period, adjust=False).mean()
    elif ma_type == 'WMA':
        weights = np.arange(1, period + 1)
        return data.rolling(window=period).apply(lambda x: np.dot(x, weights) / weights.sum(), raw=True)
    else:
        raise ValueError(f"Loại MA không hợp lệ: {ma_type}")

# Tính các đường MA
df['SMA_20'] = calculate_ma(df['close'], 20, 'SMA')
df['SMA_50'] = calculate_ma(df['close'], 50, 'SMA')
df['EMA_12'] = calculate_ma(df['close'], 12, 'EMA')
df['EMA_26'] = calculate_ma(df['close'], 26, 'EMA')
RSI (Relative Strength Index)
def calculate_rsi(data, period=14):
    """
    Tính chỉ báo RSI
    """
    delta = data.diff()
    gain = (delta.where(delta > 0, 0)).rolling(window=period).mean()
    loss = (-delta.where(delta < 0, 0)).rolling(window=period).mean()

    rs = gain / loss
    rsi = 100 - (100 / (1 + rs))

    return rsi

# Tính RSI
df['RSI'] = calculate_rsi(df['close'], 14)
MACD (Moving Average Convergence Divergence)
def calculate_macd(data, fast=12, slow=26, signal=9):
    """
    Tính chỉ báo MACD
    """
    ema_fast = calculate_ma(data, fast, 'EMA')
    ema_slow = calculate_ma(data, slow, 'EMA')

    macd_line = ema_fast - ema_slow
    signal_line = calculate_ma(macd_line, signal, 'EMA')
    histogram = macd_line - signal_line

    return macd_line, signal_line, histogram

# Tính MACD
df['MACD'], df['MACD_Signal'], df['MACD_Hist'] = calculate_macd(df['close'])
Bollinger Bands
def calculate_bollinger_bands(data, period=20, std_dev=2):
    """
    Tính Bollinger Bands
    """
    sma = calculate_ma(data, period, 'SMA')
    std = data.rolling(window=period).std()

    upper_band = sma + (std * std_dev)
    lower_band = sma - (std * std_dev)

    return upper_band, lower_band, sma

# Tính Bollinger Bands
df['BB_Upper'], df['BB_Lower'], df['BB_Middle'] = calculate_bollinger_bands(df['close'])
Bước 3: Xây dựng chiến lược Buy/Sell
Chiến lược 1: Moving Average Crossover
Đây là chiến lược phổ biến nhất – mua khi MA ngắn hạn cắt lên trên MA dài hạn:
def ma_crossover_strategy(df, short_period=20, long_period=50):
    """
    Chiến lược Moving Average Crossover
    """
    data = df.copy()

    # Tính MA
    data['MA_Short'] = calculate_ma(data['close'], short_period, 'SMA')
    data['MA_Long'] = calculate_ma(data['close'], long_period, 'SMA')

    # Tạo tín hiệu
    # 1 = Buy, -1 = Sell, 0 = Hold
    data['Signal'] = 0

    # Tín hiệu mua: MA ngắn cắt lên trên MA dài
    data.loc[data['MA_Short'] > data['MA_Long'], 'Signal'] = 1

    # Tín hiệu bán: MA ngắn cắt xuống dưới MA dài
    data.loc[data['MA_Short'] < data['MA_Long'], 'Signal'] = -1

    # Tạo Position (chỉ thay đổi khi có tín hiệu mới)
    data['Position'] = data['Signal'].diff()

    # Chỉ giữ lại các điểm mua/bán thực sự
    data['Buy_Signal'] = (data['Position'] == 2).astype(int)  # Chuyển từ -1 sang 1
    data['Sell_Signal'] = (data['Position'] == -2).astype(int)  # Chuyển từ 1 sang -1

    return data

# Áp dụng chiến lược
df_strategy1 = ma_crossover_strategy(df, short_period=20, long_period=50)
print("Số tín hiệu MUA:", df_strategy1['Buy_Signal'].sum())
print("Số tín hiệu BÁN:", df_strategy1['Sell_Signal'].sum())
Chiến lược 2: RSI Overbought/Oversold
Mua khi RSI < 30 (oversold), bán khi RSI > 70 (overbought):
def rsi_strategy(df, rsi_period=14, oversold=30, overbought=70):
    """
    Chiến lược RSI Overbought/Oversold
    """
    data = df.copy()

    # Tính RSI
    data['RSI'] = calculate_rsi(data['close'], rsi_period)

    # Tạo tín hiệu
    data['Signal'] = 0

    # Mua khi RSI < oversold
    data.loc[data['RSI'] < oversold, 'Signal'] = 1

    # Bán khi RSI > overbought
    data.loc[data['RSI'] > overbought, 'Signal'] = -1

    # Tạo Position
    data['Position'] = data['Signal'].diff()
    data['Buy_Signal'] = (data['Position'] == 1).astype(int)
    data['Sell_Signal'] = (data['Position'] == -1).astype(int)

    return data

# Áp dụng chiến lược
df_strategy2 = rsi_strategy(df, rsi_period=14, oversold=30, overbought=70)
print("Số tín hiệu MUA:", df_strategy2['Buy_Signal'].sum())
print("Số tín hiệu BÁN:", df_strategy2['Sell_Signal'].sum())
Chiến lược 3: MACD Crossover
Mua khi MACD cắt lên trên Signal line, bán khi MACD cắt xuống dưới Signal:
def macd_strategy(df, fast=12, slow=26, signal=9):
    """
    Chiến lược MACD Crossover
    """
    data = df.copy()

    # Tính MACD
    data['MACD'], data['MACD_Signal'], data['MACD_Hist'] = calculate_macd(
        data['close'], fast, slow, signal
    )

    # Tạo tín hiệu
    data['Signal'] = 0

    # Mua khi MACD cắt lên trên Signal
    data.loc[data['MACD'] > data['MACD_Signal'], 'Signal'] = 1

    # Bán khi MACD cắt xuống dưới Signal
    data.loc[data['MACD'] < data['MACD_Signal'], 'Signal'] = -1

    # Tạo Position
    data['Position'] = data['Signal'].diff()
    data['Buy_Signal'] = (data['Position'] == 2).astype(int)
    data['Sell_Signal'] = (data['Position'] == -2).astype(int)

    return data

# Áp dụng chiến lược
df_strategy3 = macd_strategy(df)
print("Số tín hiệu MUA:", df_strategy3['Buy_Signal'].sum())
print("Số tín hiệu BÁN:", df_strategy3['Sell_Signal'].sum())
Chiến lược 4: Bollinger Bands
Mua khi giá chạm lower band, bán khi giá chạm upper band:
def bollinger_bands_strategy(df, period=20, std_dev=2):
    """
    Chiến lược Bollinger Bands
    """
    data = df.copy()

    # Tính Bollinger Bands
    data['BB_Upper'], data['BB_Lower'], data['BB_Middle'] = calculate_bollinger_bands(
        data['close'], period, std_dev
    )

    # Tạo tín hiệu
    data['Signal'] = 0

    # Mua khi giá chạm hoặc vượt qua lower band
    data.loc[data['close'] <= data['BB_Lower'], 'Signal'] = 1

    # Bán khi giá chạm hoặc vượt qua upper band
    data.loc[data['close'] >= data['BB_Upper'], 'Signal'] = -1

    # Tạo Position
    data['Position'] = data['Signal'].diff()
    data['Buy_Signal'] = (data['Position'] == 1).astype(int)
    data['Sell_Signal'] = (data['Position'] == -1).astype(int)

    return data

# Áp dụng chiến lược
df_strategy4 = bollinger_bands_strategy(df)
print("Số tín hiệu MUA:", df_strategy4['Buy_Signal'].sum())
print("Số tín hiệu BÁN:", df_strategy4['Sell_Signal'].sum())
Chiến lược 5: Kết hợp nhiều chỉ báo (Multi-Indicator Strategy)
Kết hợp nhiều chỉ báo để tăng độ chính xác:
def multi_indicator_strategy(df,
                            ma_short=20, ma_long=50,
                            rsi_period=14, rsi_oversold=30, rsi_overbought=70,
                            macd_fast=12, macd_slow=26, macd_signal=9):
    """
    Chiến lược kết hợp nhiều chỉ báo
    Mua khi: MA Short > MA Long VÀ RSI < Oversold VÀ MACD > Signal
    Bán khi: MA Short < MA Long VÀ RSI > Overbought VÀ MACD < Signal
    """
    data = df.copy()

    # Tính các chỉ báo
    data['MA_Short'] = calculate_ma(data['close'], ma_short, 'SMA')
    data['MA_Long'] = calculate_ma(data['close'], ma_long, 'SMA')
    data['RSI'] = calculate_rsi(data['close'], rsi_period)
    data['MACD'], data['MACD_Signal'], _ = calculate_macd(
        data['close'], macd_fast, macd_slow, macd_signal
    )

    # Điều kiện mua: Tất cả điều kiện phải thỏa mãn
    buy_condition = (
        (data['MA_Short'] > data['MA_Long']) &
        (data['RSI'] < rsi_oversold) &
        (data['MACD'] > data['MACD_Signal'])
    )

    # Điều kiện bán: Tất cả điều kiện phải thỏa mãn
    sell_condition = (
        (data['MA_Short'] < data['MA_Long']) &
        (data['RSI'] > rsi_overbought) &
        (data['MACD'] < data['MACD_Signal'])
    )

    # Tạo tín hiệu
    data['Signal'] = 0
    data.loc[buy_condition, 'Signal'] = 1
    data.loc[sell_condition, 'Signal'] = -1

    # Tạo Position
    data['Position'] = data['Signal'].diff()
    data['Buy_Signal'] = (data['Position'] == 1).astype(int)
    data['Sell_Signal'] = (data['Position'] == -1).astype(int)

    return data

# Áp dụng chiến lược
df_strategy5 = multi_indicator_strategy(df)
print("Số tín hiệu MUA:", df_strategy5['Buy_Signal'].sum())
print("Số tín hiệu BÁN:", df_strategy5['Sell_Signal'].sum())
Bước 4: Thêm Stop Loss và Take Profit
Quản lý rủi ro là phần quan trọng trong trading:
def add_stop_loss_take_profit(df, stop_loss_pct=0.02, take_profit_pct=0.05):
    """
    Thêm Stop Loss và Take Profit vào chiến lược

    Parameters:
    stop_loss_pct: Phần trăm stop loss (ví dụ: 0.02 = 2%)
    take_profit_pct: Phần trăm take profit (ví dụ: 0.05 = 5%)
    """
    data = df.copy()

    # Khởi tạo các cột
    data['Entry_Price'] = np.nan
    data['Stop_Loss'] = np.nan
    data['Take_Profit'] = np.nan
    data['Exit_Signal'] = 0
    data['Position_Status'] = 0  # 0: Không có vị thế, 1: Đang nắm giữ

    entry_price = None
    position = 0  # 0: Không có, 1: Đang nắm giữ

    for i in range(len(data)):
        # Nếu có tín hiệu mua và chưa có vị thế
        if data['Buy_Signal'].iloc[i] == 1 and position == 0:
            entry_price = data['close'].iloc[i]
            data.loc[data.index[i], 'Entry_Price'] = entry_price
            data.loc[data.index[i], 'Stop_Loss'] = entry_price * (1 - stop_loss_pct)
            data.loc[data.index[i], 'Take_Profit'] = entry_price * (1 + take_profit_pct)
            position = 1
            data.loc[data.index[i], 'Position_Status'] = 1

        # Nếu đang có vị thế, kiểm tra stop loss và take profit
        elif position == 1 and entry_price is not None:
            current_price = data['close'].iloc[i]

            # Kiểm tra Stop Loss
            if current_price <= entry_price * (1 - stop_loss_pct):
                data.loc[data.index[i], 'Exit_Signal'] = -1
                position = 0
                entry_price = None

            # Kiểm tra Take Profit
            elif current_price >= entry_price * (1 + take_profit_pct):
                data.loc[data.index[i], 'Exit_Signal'] = 1
                position = 0
                entry_price = None

            # Kiểm tra tín hiệu bán thông thường
            elif data['Sell_Signal'].iloc[i] == 1:
                data.loc[data.index[i], 'Exit_Signal'] = -1
                position = 0
                entry_price = None
            else:
                data.loc[data.index[i], 'Position_Status'] = 1

        # Cập nhật trạng thái
        if position == 0:
            data.loc[data.index[i], 'Position_Status'] = 0

    return data

# Thêm Stop Loss và Take Profit
df_with_sl_tp = add_stop_loss_take_profit(df_strategy1, stop_loss_pct=0.02, take_profit_pct=0.05)
print("Số lần chạm Stop Loss:", (df_with_sl_tp['Exit_Signal'] == -1).sum())
print("Số lần chạm Take Profit:", (df_with_sl_tp['Exit_Signal'] == 1).sum())
Bước 5: Backtesting chiến lược
Backtesting giúp đánh giá hiệu quả của chiến lược trên dữ liệu lịch sử:
def backtest_strategy(df, initial_capital=10000, commission=0.001):
    """
    Backtest chiến lược giao dịch

    Parameters:
    initial_capital: Vốn ban đầu
    commission: Phí giao dịch (ví dụ: 0.001 = 0.1%)
    """
    data = df.copy()

    capital = initial_capital
    position = 0  # Số lượng coin/cổ phiếu đang nắm giữ
    trades = []
    equity_curve = [initial_capital]

    for i in range(len(data)):
        current_price = data['close'].iloc[i]

        # Tín hiệu mua
        if data['Buy_Signal'].iloc[i] == 1 and position == 0:
            # Tính số lượng có thể mua (trừ phí)
            available_capital = capital * (1 - commission)
            position = available_capital / current_price
            capital = 0

            trades.append({
                'date': data.index[i],
                'action': 'BUY',
                'price': current_price,
                'shares': position,
                'capital_used': available_capital
            })

        # Tín hiệu bán hoặc Exit Signal
        elif (data['Sell_Signal'].iloc[i] == 1 or data['Exit_Signal'].iloc[i] != 0) and position > 0:
            # Tính vốn sau khi bán (trừ phí)
            capital = position * current_price * (1 - commission)

            trades.append({
                'date': data.index[i],
                'action': 'SELL',
                'price': current_price,
                'shares': position,
                'capital_received': capital
            })

            position = 0

        # Tính giá trị danh mục hiện tại
        if position > 0:
            portfolio_value = position * current_price
        else:
            portfolio_value = capital

        equity_curve.append(portfolio_value)

    # Tính toán kết quả
    final_capital = equity_curve[-1]
    total_return = ((final_capital - initial_capital) / initial_capital) * 100

    # Tính các chỉ số hiệu suất
    equity_series = pd.Series(equity_curve)
    returns = equity_series.pct_change().dropna()

    if len(returns) > 0:
        sharpe_ratio = returns.mean() / returns.std() * np.sqrt(252) if returns.std() > 0 else 0
        max_drawdown = ((equity_series / equity_series.expanding().max()) - 1).min() * 100
    else:
        sharpe_ratio = 0
        max_drawdown = 0

    results = {
        'initial_capital': initial_capital,
        'final_capital': final_capital,
        'total_return': total_return,
        'total_trades': len(trades),
        'sharpe_ratio': sharpe_ratio,
        'max_drawdown': max_drawdown,
        'trades': trades,
        'equity_curve': equity_curve
    }

    return results, data

# Backtest chiến lược
results, df_backtest = backtest_strategy(df_strategy1, initial_capital=10000, commission=0.001)

print("=" * 50)
print("KẾT QUẢ BACKTEST")
print("=" * 50)
print(f"Vốn ban đầu: ${results['initial_capital']:,.2f}")
print(f"Vốn cuối cùng: ${results['final_capital']:,.2f}")
print(f"Lợi nhuận: {results['total_return']:.2f}%")
print(f"Tổng số giao dịch: {results['total_trades']}")
print(f"Sharpe Ratio: {results['sharpe_ratio']:.2f}")
print(f"Max Drawdown: {results['max_drawdown']:.2f}%")
Bước 6: Trực quan hóa kết quả
def visualize_strategy(df, results, strategy_name="Strategy"):
    """
    Vẽ biểu đồ chiến lược và kết quả
    """
    fig, axes = plt.subplots(3, 1, figsize=(16, 12), sharex=True)

    # Biểu đồ 1: Giá và tín hiệu
    ax1 = axes[0]
    ax1.plot(df.index, df['close'], label='Giá đóng cửa', linewidth=2, color='black')

    # Vẽ các đường MA nếu có
    if 'MA_Short' in df.columns and 'MA_Long' in df.columns:
        ax1.plot(df.index, df['MA_Short'], label='MA Short', linewidth=1.5, alpha=0.7)
        ax1.plot(df.index, df['MA_Long'], label='MA Long', linewidth=1.5, alpha=0.7)

    # Đánh dấu điểm mua
    buy_signals = df[df['Buy_Signal'] == 1]
    ax1.scatter(buy_signals.index, buy_signals['close'],
               marker='^', color='green', s=100, label='Tín hiệu MUA', zorder=5)

    # Đánh dấu điểm bán
    sell_signals = df[df['Sell_Signal'] == 1]
    ax1.scatter(sell_signals.index, sell_signals['close'],
               marker='v', color='red', s=100, label='Tín hiệu BÁN', zorder=5)

    ax1.set_title(f'{strategy_name} - Giá và Tín hiệu', fontsize=14, fontweight='bold')
    ax1.set_ylabel('Giá')
    ax1.legend()
    ax1.grid(True, alpha=0.3)

    # Biểu đồ 2: Equity Curve
    ax2 = axes[1]
    equity_curve = pd.Series(results['equity_curve'], index=df.index[:len(results['equity_curve'])])
    ax2.plot(equity_curve.index, equity_curve.values, label='Equity Curve', linewidth=2, color='blue')
    ax2.axhline(y=results['initial_capital'], color='red', linestyle='--', label='Vốn ban đầu')
    ax2.set_title('Equity Curve', fontsize=14, fontweight='bold')
    ax2.set_ylabel('Giá trị danh mục ($)')
    ax2.legend()
    ax2.grid(True, alpha=0.3)

    # Biểu đồ 3: Drawdown
    ax3 = axes[2]
    equity_series = pd.Series(results['equity_curve'])
    running_max = equity_series.expanding().max()
    drawdown = ((equity_series / running_max) - 1) * 100
    ax3.fill_between(drawdown.index, drawdown.values, 0, alpha=0.3, color='red')
    ax3.plot(drawdown.index, drawdown.values, linewidth=1, color='red')
    ax3.set_title('Drawdown', fontsize=14, fontweight='bold')
    ax3.set_xlabel('Thời gian')
    ax3.set_ylabel('Drawdown (%)')
    ax3.grid(True, alpha=0.3)

    plt.tight_layout()
    plt.show()

# Vẽ biểu đồ
visualize_strategy(df_strategy1, results, "Moving Average Crossover")
Ví dụ hoàn chỉnh: Hệ thống Bot Trading
Dưới đây là một ví dụ hoàn chỉnh kết hợp tất cả các bước:
class TradingBot:
    """
    Lớp Bot Trading hoàn chỉnh
    """
    def __init__(self, symbol, initial_capital=10000, commission=0.001):
        self.symbol = symbol
        self.initial_capital = initial_capital
        self.commission = commission
        self.df = None
        self.results = None

    def load_data(self, period='6mo', interval='1d'):
        """Lấy và chuẩn bị dữ liệu"""
        self.df = get_price_data(self.symbol, period, interval)
        self.df = prepare_data(self.df)
        return self.df

    def calculate_indicators(self):
        """Tính toán các chỉ báo"""
        if self.df is None:
            raise ValueError("Chưa có dữ liệu. Hãy gọi load_data() trước.")

        # MA
        self.df['MA_Short'] = calculate_ma(self.df['close'], 20, 'SMA')
        self.df['MA_Long'] = calculate_ma(self.df['close'], 50, 'SMA')

        # RSI
        self.df['RSI'] = calculate_rsi(self.df['close'], 14)

        # MACD
        self.df['MACD'], self.df['MACD_Signal'], _ = calculate_macd(self.df['close'])

        return self.df

    def generate_signals(self, strategy='ma_crossover'):
        """Tạo tín hiệu mua/bán"""
        if self.df is None:
            raise ValueError("Chưa có dữ liệu.")

        if strategy == 'ma_crossover':
            self.df = ma_crossover_strategy(self.df)
        elif strategy == 'rsi':
            self.df = rsi_strategy(self.df)
        elif strategy == 'macd':
            self.df = macd_strategy(self.df)
        elif strategy == 'multi':
            self.df = multi_indicator_strategy(self.df)
        else:
            raise ValueError(f"Chiến lược không hợp lệ: {strategy}")

        # Thêm Stop Loss và Take Profit
        self.df = add_stop_loss_take_profit(self.df)

        return self.df

    def backtest(self):
        """Backtest chiến lược"""
        if self.df is None:
            raise ValueError("Chưa có dữ liệu.")

        self.results, self.df = backtest_strategy(
            self.df,
            self.initial_capital,
            self.commission
        )

        return self.results

    def print_results(self):
        """In kết quả backtest"""
        if self.results is None:
            print("Chưa có kết quả backtest.")
            return

        print("=" * 60)
        print("KẾT QUẢ BACKTEST")
        print("=" * 60)
        print(f"Symbol: {self.symbol}")
        print(f"Vốn ban đầu: ${self.results['initial_capital']:,.2f}")
        print(f"Vốn cuối cùng: ${self.results['final_capital']:,.2f}")
        print(f"Lợi nhuận: {self.results['total_return']:.2f}%")
        print(f"Tổng số giao dịch: {self.results['total_trades']}")
        print(f"Sharpe Ratio: {self.results['sharpe_ratio']:.2f}")
        print(f"Max Drawdown: {self.results['max_drawdown']:.2f}%")
        print("=" * 60)

    def visualize(self, strategy_name="Strategy"):
        """Vẽ biểu đồ"""
        if self.results is None:
            print("Chưa có kết quả backtest.")
            return

        visualize_strategy(self.df, self.results, strategy_name)

# Sử dụng Bot Trading
bot = TradingBot('BTC-USD', initial_capital=10000, commission=0.001)

# Load dữ liệu
bot.load_data(period='6mo', interval='1d')

# Tính chỉ báo
bot.calculate_indicators()

# Tạo tín hiệu với chiến lược MA Crossover
bot.generate_signals(strategy='ma_crossover')

# Backtest
bot.backtest()

# In kết quả
bot.print_results()

# Vẽ biểu đồ
bot.visualize("Moving Average Crossover Strategy")
Kết luận
Tính toán chiến lược Buy/Sell với DataFrame trong Python là nền tảng quan trọng để xây dựng bot giao dịch tự động. Với Pandas, bạn có thể:
- Xử lý và chuẩn bị dữ liệu giá hiệu quả
- Tính toán các chỉ báo kỹ thuật phức tạp
- Xây dựng nhiều chiến lược giao dịch khác nhau
- Thêm quản lý rủi ro với Stop Loss và Take Profit
- Backtest và đánh giá hiệu quả chiến lược
- Trực quan hóa kết quả
Để tìm hiểu thêm về xử lý dữ liệu với DataFrame, bạn có thể xem bài viết Giới thiệu về Pandas hoặc Thống kê lượng với DataFrame. Nếu bạn muốn tìm hiểu về các chỉ báo kỹ thuật, hãy tham khảo bài viết Phân tích kỹ thuật với Python.
Tài liệu tham khảo
Từ tín hiệu DataFrame đến bot live: tham gia xây dựng bot auto trading Python — Vibe Code 24 buổi.
Bài viết gần đây
-
Bot Auto Trading là gì? Hướng dẫn xây dựng bot thực chiến 2026
Tháng 8 2, 2026 -
Nhật ký vận hành Bot MT5: mẫu 7 ngày & khi nào phải dừng bot
Tháng 8 1, 2026 -
Cài MT5 trên VPS từ A→Z & giữ Terminal sống sau khi đóng RDP
Tháng 8 1, 2026
| Thống kê lượng với DataFrame trên Python
Được viết bởi thanhdt vào ngày 16/11/2025 lúc 10:48 | 177 lượt xem

Thống kê lượng với DataFrame trên Python
Thống kê lượng (descriptive statistics) là một phần quan trọng trong phân tích dữ liệu, giúp bạn hiểu được đặc điểm và xu hướng của dữ liệu. Với Pandas DataFrame, việc thực hiện các phép thống kê trở nên đơn giản và hiệu quả. Bài viết này sẽ hướng dẫn bạn cách sử dụng các hàm thống kê trong Pandas để phân tích dữ liệu.
Thống kê mô tả là gì?
Thống kê mô tả là các phép toán giúp tóm tắt và mô tả các đặc điểm chính của dữ liệu mà không cần suy luận về toàn bộ quần thể. Các thống kê mô tả phổ biến bao gồm:
- Trung bình (Mean): Giá trị trung bình của dữ liệu
- Trung vị (Median): Giá trị ở giữa khi sắp xếp dữ liệu
- Độ lệch chuẩn (Standard Deviation): Đo lường độ phân tán của dữ liệu
- Phương sai (Variance): Bình phương của độ lệch chuẩn
- Tứ phân vị (Quartiles): Chia dữ liệu thành 4 phần bằng nhau
- Min/Max: Giá trị nhỏ nhất và lớn nhất
Cài đặt và import thư viện
Trước khi bắt đầu, bạn cần import các thư viện cần thiết:
import pandas as pd
import numpy as np
import matplotlib.pyplot as plt
import seaborn as sns

# Thiết lập hiển thị
pd.set_option('display.max_columns', None)
pd.set_option('display.width', None)
Tạo dữ liệu mẫu
Để minh họa, chúng ta sẽ tạo một DataFrame mẫu về doanh số bán hàng:
# Tạo dữ liệu mẫu
np.random.seed(42)
data = {
    'Ngày': pd.date_range('2024-01-01', periods=100, freq='D'),
    'Doanh_thu': np.random.normal(50000, 10000, 100),
    'Số_lượng': np.random.randint(100, 500, 100),
    'Chi_phí': np.random.normal(30000, 5000, 100),
    'Khu_vực': np.random.choice(['Miền Bắc', 'Miền Trung', 'Miền Nam'], 100),
    'Sản_phẩm': np.random.choice(['A', 'B', 'C', 'D'], 100)
}

df = pd.DataFrame(data)

# Tính thêm cột Lợi nhuận
df['Lợi_nhuận'] = df['Doanh_thu'] - df['Chi_phí']
df['Tỷ_lệ_lợi_nhuận'] = (df['Lợi_nhuận'] / df['Doanh_thu']) * 100

# Hiển thị 5 dòng đầu
print(df.head())
Thống kê mô tả cơ bản với describe()
Hàm describe() là cách nhanh nhất để xem tổng quan về dữ liệu:
# Thống kê mô tả cho tất cả các cột số
print(df.describe())

# Thống kê mô tả cho một cột cụ thể
print(df['Doanh_thu'].describe())

# Thống kê mô tả với các tứ phân vị tùy chỉnh
print(df.describe(percentiles=[0.1, 0.25, 0.5, 0.75, 0.9]))

# Thống kê mô tả bao gồm cả dữ liệu không phải số
print(df.describe(include='all'))
Kết quả của describe() bao gồm:
- count: Số lượng giá trị không phải NaN
- mean: Giá trị trung bình
- std: Độ lệch chuẩn
- min: Giá trị nhỏ nhất
- 25%: Tứ phân vị thứ nhất (Q1)
- 50%: Trung vị (Q2)
- 75%: Tứ phân vị thứ ba (Q3)
- max: Giá trị lớn nhất
Các hàm thống kê cơ bản
Trung bình (Mean)
# Trung bình của một cột
mean_revenue = df['Doanh_thu'].mean()
print(f"Trung bình doanh thu: {mean_revenue:,.2f}")

# Trung bình của nhiều cột
mean_multiple = df[['Doanh_thu', 'Chi_phí', 'Lợi_nhuận']].mean()
print(mean_multiple)

# Trung bình theo trục (axis)
# axis=0: tính theo cột (mặc định)
# axis=1: tính theo hàng
mean_by_row = df[['Doanh_thu', 'Chi_phí']].mean(axis=1)
print(mean_by_row.head())
Trung vị (Median)
# Trung vị của một cột
median_revenue = df['Doanh_thu'].median()
print(f"Trung vị doanh thu: {median_revenue:,.2f}")

# Trung vị của nhiều cột
median_multiple = df[['Doanh_thu', 'Chi_phí', 'Lợi_nhuận']].median()
print(median_multiple)
Độ lệch chuẩn và Phương sai
# Độ lệch chuẩn
std_revenue = df['Doanh_thu'].std()
print(f"Độ lệch chuẩn doanh thu: {std_revenue:,.2f}")

# Phương sai
var_revenue = df['Doanh_thu'].var()
print(f"Phương sai doanh thu: {var_revenue:,.2f}")

# Hệ số biến thiên (CV) = std/mean
cv = df['Doanh_thu'].std() / df['Doanh_thu'].mean()
print(f"Hệ số biến thiên: {cv:.2%}")
Min, Max và Range
# Giá trị nhỏ nhất
min_revenue = df['Doanh_thu'].min()
print(f"Doanh thu nhỏ nhất: {min_revenue:,.2f}")

# Giá trị lớn nhất
max_revenue = df['Doanh_thu'].max()
print(f"Doanh thu lớn nhất: {max_revenue:,.2f}")

# Khoảng biến thiên (Range)
range_revenue = df['Doanh_thu'].max() - df['Doanh_thu'].min()
print(f"Khoảng biến thiên: {range_revenue:,.2f}")

# Hoặc sử dụng ptp (peak to peak)
range_ptp = df['Doanh_thu'].ptp()
print(f"Khoảng biến thiên (ptp): {range_ptp:,.2f}")
Tứ phân vị (Quartiles)
# Tứ phân vị thứ nhất (Q1 - 25%)
q1 = df['Doanh_thu'].quantile(0.25)
print(f"Q1 (25%): {q1:,.2f}")

# Trung vị (Q2 - 50%)
q2 = df['Doanh_thu'].quantile(0.5)
print(f"Q2 (50%): {q2:,.2f}")

# Tứ phân vị thứ ba (Q3 - 75%)
q3 = df['Doanh_thu'].quantile(0.75)
print(f"Q3 (75%): {q3:,.2f}")

# Khoảng tứ phân vị (IQR - Interquartile Range)
iqr = q3 - q1
print(f"IQR: {iqr:,.2f}")

# Tất cả các tứ phân vị cùng lúc
quartiles = df['Doanh_thu'].quantile([0.25, 0.5, 0.75])
print(quartiles)
Tổng và Đếm
# Tổng
total_revenue = df['Doanh_thu'].sum()
print(f"Tổng doanh thu: {total_revenue:,.2f}")

# Đếm số lượng (không tính NaN)
count = df['Doanh_thu'].count()
print(f"Số lượng giá trị: {count}")

# Đếm tất cả (kể cả NaN)
count_all = df['Doanh_thu'].size
print(f"Tổng số phần tử: {count_all}")

# Đếm số giá trị duy nhất
unique_count = df['Khu_vực'].nunique()
print(f"Số khu vực duy nhất: {unique_count}")

# Đếm số lần xuất hiện của mỗi giá trị
value_counts = df['Khu_vực'].value_counts()
print(value_counts)
Thống kê theo nhóm (GroupBy)
Một trong những tính năng mạnh mẽ nhất của Pandas là thống kê theo nhóm:
# Thống kê theo khu vực
stats_by_region = df.groupby('Khu_vực')['Doanh_thu'].agg(['mean', 'median', 'std', 'min', 'max'])
print(stats_by_region)

# Nhiều hàm thống kê cho nhiều cột
stats_multiple = df.groupby('Khu_vực')[['Doanh_thu', 'Chi_phí', 'Lợi_nhuận']].agg({
    'Doanh_thu': ['mean', 'sum', 'std'],
    'Chi_phí': ['mean', 'sum'],
    'Lợi_nhuận': ['mean', 'sum', 'min', 'max']
})
print(stats_multiple)

# Thống kê theo nhiều cột nhóm
stats_multi_group = df.groupby(['Khu_vực', 'Sản_phẩm'])['Doanh_thu'].agg(['mean', 'sum', 'count'])
print(stats_multi_group)
Sử dụng agg() cho thống kê tùy chỉnh
Hàm agg() cho phép bạn áp dụng nhiều hàm thống kê cùng lúc:
# Áp dụng nhiều hàm cho một cột
stats_custom = df['Doanh_thu'].agg(['mean', 'median', 'std', 'min', 'max', 'sum'])
print(stats_custom)

# Áp dụng hàm tùy chỉnh
def coefficient_of_variation(series):
    """Tính hệ số biến thiên"""
    return series.std() / series.mean()

custom_stats = df['Doanh_thu'].agg(['mean', 'std', coefficient_of_variation])
print(custom_stats)

# Với GroupBy
grouped_stats = df.groupby('Khu_vực')['Doanh_thu'].agg([
    'mean',
    'std',
    ('cv', coefficient_of_variation),
    ('range', lambda x: x.max() - x.min())
])
print(grouped_stats)
Thống kê mô tả nâng cao
Độ lệch (Skewness) và Độ nhọn (Kurtosis)
# Độ lệch (Skewness) - đo độ bất đối xứng
# > 0: lệch phải, < 0: lệch trái, = 0: đối xứng
skew = df['Doanh_thu'].skew()
print(f"Độ lệch: {skew:.2f}")

# Độ nhọn (Kurtosis) - đo độ nhọn của phân phối
# > 3: nhọn hơn phân phối chuẩn, < 3: phẳng hơn
kurtosis = df['Doanh_thu'].kurtosis()
print(f"Độ nhọn: {kurtosis:.2f}")

# Sử dụng scipy để tính chính xác hơn
from scipy import stats
skew_scipy = stats.skew(df['Doanh_thu'])
kurtosis_scipy = stats.kurtosis(df['Doanh_thu'])
print(f"Độ lệch (scipy): {skew_scipy:.2f}")
print(f"Độ nhọn (scipy): {kurtosis_scipy:.2f}")
Phân phối chuẩn hóa (Z-score)
# Tính Z-score (chuẩn hóa)
df['Doanh_thu_zscore'] = (df['Doanh_thu'] - df['Doanh_thu'].mean()) / df['Doanh_thu'].std()

# Hoặc sử dụng scipy
from scipy.stats import zscore
df['Doanh_thu_zscore2'] = zscore(df['Doanh_thu'])

# Tìm các giá trị ngoại lai (outliers) với Z-score > 3 hoặc < -3
outliers = df[abs(df['Doanh_thu_zscore']) > 3]
print(f"Số lượng giá trị ngoại lai: {len(outliers)}")
print(outliers[['Ngày', 'Doanh_thu', 'Doanh_thu_zscore']])
Tứ phân vị và Box Plot
# Tính tất cả các tứ phân vị
percentiles = [0, 0.1, 0.25, 0.5, 0.75, 0.9, 1.0]
percentile_values = df['Doanh_thu'].quantile(percentiles)
print(percentile_values)

# Vẽ box plot để trực quan hóa
plt.figure(figsize=(10, 6))
df.boxplot(column='Doanh_thu', by='Khu_vực', figsize=(10, 6))
plt.title('Box Plot Doanh thu theo Khu vực')
plt.suptitle('')  # Xóa tiêu đề mặc định
plt.ylabel('Doanh thu')
plt.show()
Tương quan và Hiệp phương sai
# Ma trận tương quan
correlation_matrix = df[['Doanh_thu', 'Chi_phí', 'Lợi_nhuận', 'Số_lượng']].corr()
print(correlation_matrix)

# Tương quan giữa hai cột cụ thể
corr_revenue_profit = df['Doanh_thu'].corr(df['Lợi_nhuận'])
print(f"Tương quan Doanh thu - Lợi nhuận: {corr_revenue_profit:.2f}")

# Ma trận hiệp phương sai
covariance_matrix = df[['Doanh_thu', 'Chi_phí', 'Lợi_nhuận']].cov()
print(covariance_matrix)

# Vẽ heatmap tương quan
plt.figure(figsize=(10, 8))
sns.heatmap(correlation_matrix, annot=True, cmap='coolwarm', center=0,
            square=True, linewidths=1, cbar_kws={"shrink": 0.8})
plt.title('Ma trận Tương quan')
plt.tight_layout()
plt.show()
Thống kê theo thời gian
Khi làm việc với dữ liệu thời gian, bạn có thể tính thống kê theo các khoảng thời gian:
# Đặt Ngày làm index
df_time = df.set_index('Ngày')

# Thống kê theo tuần
weekly_stats = df_time['Doanh_thu'].resample('W').agg(['mean', 'sum', 'std'])
print(weekly_stats.head())

# Thống kê theo tháng
monthly_stats = df_time['Doanh_thu'].resample('M').agg(['mean', 'sum', 'std', 'min', 'max'])
print(monthly_stats)

# Thống kê theo quý
quarterly_stats = df_time['Doanh_thu'].resample('Q').agg(['mean', 'sum'])
print(quarterly_stats)
Ví dụ thực tế: Báo cáo thống kê hoàn chỉnh
Dưới đây là một ví dụ tạo báo cáo thống kê hoàn chỉnh:
def generate_statistics_report(df, numeric_columns):
    """
    Tạo báo cáo thống kê chi tiết cho các cột số
    """
    report = {}

    for col in numeric_columns:
        series = df[col]
        report[col] = {
            'Số lượng': series.count(),
            'Trung bình': series.mean(),
            'Trung vị': series.median(),
            'Độ lệch chuẩn': series.std(),
            'Phương sai': series.var(),
            'Min': series.min(),
            'Q1 (25%)': series.quantile(0.25),
            'Q2 (50%)': series.quantile(0.5),
            'Q3 (75%)': series.quantile(0.75),
            'Max': series.max(),
            'IQR': series.quantile(0.75) - series.quantile(0.25),
            'Range': series.max() - series.min(),
            'Độ lệch': series.skew(),
            'Độ nhọn': series.kurtosis(),
            'Hệ số biến thiên': series.std() / series.mean()
        }

    report_df = pd.DataFrame(report).T
    return report_df

# Tạo báo cáo
numeric_cols = ['Doanh_thu', 'Chi_phí', 'Lợi_nhuận', 'Số_lượng']
report = generate_statistics_report(df, numeric_cols)
print(report.round(2))
Trực quan hóa thống kê
# Vẽ histogram với thống kê
fig, axes = plt.subplots(2, 2, figsize=(15, 12))

# Histogram Doanh thu
axes[0, 0].hist(df['Doanh_thu'], bins=20, edgecolor='black', alpha=0.7)
axes[0, 0].axvline(df['Doanh_thu'].mean(), color='r', linestyle='--', label=f'Mean: {df["Doanh_thu"].mean():,.0f}')
axes[0, 0].axvline(df['Doanh_thu'].median(), color='g', linestyle='--', label=f'Median: {df["Doanh_thu"].median():,.0f}')
axes[0, 0].set_title('Phân phối Doanh thu')
axes[0, 0].set_xlabel('Doanh thu')
axes[0, 0].set_ylabel('Tần suất')
axes[0, 0].legend()
axes[0, 0].grid(True, alpha=0.3)

# Box plot theo Khu vực
df.boxplot(column='Doanh_thu', by='Khu_vực', ax=axes[0, 1])
axes[0, 1].set_title('Doanh thu theo Khu vực')
axes[0, 1].set_xlabel('Khu vực')
axes[0, 1].set_ylabel('Doanh thu')

# Scatter plot Doanh thu vs Lợi nhuận
axes[1, 0].scatter(df['Doanh_thu'], df['Lợi_nhuận'], alpha=0.6)
axes[1, 0].set_title('Tương quan Doanh thu - Lợi nhuận')
axes[1, 0].set_xlabel('Doanh thu')
axes[1, 0].set_ylabel('Lợi nhuận')
axes[1, 0].grid(True, alpha=0.3)

# Bar chart trung bình theo Khu vực
mean_by_region = df.groupby('Khu_vực')['Doanh_thu'].mean()
axes[1, 1].bar(mean_by_region.index, mean_by_region.values, color=['#1f77b4', '#ff7f0e', '#2ca02c'])
axes[1, 1].set_title('Trung bình Doanh thu theo Khu vực')
axes[1, 1].set_xlabel('Khu vực')
axes[1, 1].set_ylabel('Doanh thu trung bình')
axes[1, 1].grid(True, alpha=0.3, axis='y')

plt.tight_layout()
plt.show()
Xử lý dữ liệu thiếu trong thống kê
# Tạo dữ liệu có giá trị thiếu
df_missing = df.copy()
df_missing.loc[df_missing.sample(10).index, 'Doanh_thu'] = np.nan

# Thống kê với dữ liệu thiếu
print("Số lượng giá trị thiếu:", df_missing['Doanh_thu'].isna().sum())
print("Thống kê (bỏ qua NaN):")
print(df_missing['Doanh_thu'].describe())

# Thống kê với skipna=False (sẽ trả về NaN nếu có giá trị thiếu)
mean_with_na = df_missing['Doanh_thu'].mean(skipna=False)
print(f"\nTrung bình (không bỏ qua NaN): {mean_with_na}")

# Điền giá trị thiếu trước khi tính thống kê
df_filled = df_missing.copy()
df_filled['Doanh_thu'].fillna(df_filled['Doanh_thu'].mean(), inplace=True)
print("\nThống kê sau khi điền giá trị thiếu:")
print(df_filled['Doanh_thu'].describe())
Kết luận
Thống kê lượng với DataFrame trong Python là một công cụ mạnh mẽ để phân tích và hiểu dữ liệu. Với Pandas, bạn có thể:
- Tính toán các thống kê mô tả cơ bản và nâng cao
- Phân tích dữ liệu theo nhóm
- Trực quan hóa kết quả thống kê
- Xử lý dữ liệu thiếu trong quá trình tính toán
- Tạo báo cáo thống kê tự động
Để tìm hiểu thêm về Pandas, bạn có thể xem bài viết Giới thiệu về Pandas. Nếu bạn muốn áp dụng thống kê trong phân tích tài chính, hãy tham khảo bài viết Phân tích kỹ thuật với Python.
Tài liệu tham khảo
Bài viết gần đây
-
Bot Auto Trading là gì? Hướng dẫn xây dựng bot thực chiến 2026
Tháng 8 2, 2026 -
Nhật ký vận hành Bot MT5: mẫu 7 ngày & khi nào phải dừng bot
Tháng 8 1, 2026 -
Cài MT5 trên VPS từ A→Z & giữ Terminal sống sau khi đóng RDP
Tháng 8 1, 2026
| Phân tích kỹ thuật auto trading với Python: Hướng dẫn toàn diện cho người mới bắt đầu
Được viết bởi thanhdt vào ngày 16/11/2025 lúc 10:42 | 242 lượt xem

Phân tích kỹ thuật với Python
Phân tích kỹ thuật là phương pháp phân tích thị trường tài chính bằng cách sử dụng các mô hình giá cả lịch sử, khối lượng giao dịch và các chỉ báo kỹ thuật khác để dự đoán biến động giá trong tương lai. Python, với các thư viện phân tích dữ liệu mạnh mẽ như Pandas, NumPy, và Matplotlib, là công cụ lý tưởng để thực hiện phân tích kỹ thuật một cách chuyên nghiệp.
Phân tích kỹ thuật là gì?
Phân tích kỹ thuật là một phương pháp dự đoán hướng giá của tài sản tài chính dựa trên việc nghiên cứu các dữ liệu giao dịch trong quá khứ, đặc biệt là giá và khối lượng. Khác với phân tích cơ bản (fundamental analysis) tập trung vào các yếu tố kinh tế và tài chính của công ty, phân tích kỹ thuật dựa trên giả định rằng:
- Giá phản ánh tất cả thông tin
- Giá di chuyển theo xu hướng
- Lịch sử có xu hướng lặp lại
Tại sao sử dụng Python cho phân tích kỹ thuật?
Python là ngôn ngữ lập trình lý tưởng cho phân tích kỹ thuật vì:
- Thư viện phong phú: Pandas, NumPy, Matplotlib, yfinance, TA-Lib
- Xử lý dữ liệu mạnh mẽ: Dễ dàng đọc và xử lý dữ liệu giá từ nhiều nguồn
- Trực quan hóa tốt: Tạo biểu đồ nến, biểu đồ đường, và các chỉ báo kỹ thuật
- Tự động hóa: Xây dựng hệ thống phân tích và giao dịch tự động
- Cộng đồng lớn: Nhiều tài liệu và ví dụ có sẵn
Cài đặt các thư viện cần thiết
Trước khi bắt đầu, bạn cần cài đặt các thư viện Python sau:
# Cài đặt các thư viện cơ bản
pip install pandas numpy matplotlib

# Thư viện lấy dữ liệu tài chính
pip install yfinance

# Thư viện tính toán chỉ báo kỹ thuật
pip install ta-lib

# Thư viện vẽ biểu đồ nến
pip install mplfinance
Lấy dữ liệu giá từ thị trường
Sử dụng yfinance
yfinance là thư viện phổ biến để lấy dữ liệu giá từ Yahoo Finance:
import yfinance as yf
import pandas as pd

# Lấy dữ liệu giá cổ phiếu Apple (AAPL)
ticker = yf.Ticker("AAPL")
data = ticker.history(period="1y")  # Lấy dữ liệu 1 năm

# Hiển thị 5 dòng đầu tiên
print(data.head())

# Lấy dữ liệu Bitcoin
btc = yf.download("BTC-USD", period="6mo", interval="1d")
print(btc.head())
Lấy dữ liệu từ Binance API
Nếu bạn muốn lấy dữ liệu từ Binance, có thể sử dụng API:
import requests
import pandas as pd

def get_binance_data(symbol, interval='1d', limit=500):
    """
    Lấy dữ liệu giá từ Binance API

    Parameters:
    symbol: Cặp giao dịch (ví dụ: 'BTCUSDT')
    interval: Khung thời gian ('1m', '5m', '1h', '1d', ...)
    limit: Số lượng nến cần lấy
    """
    url = f"https://api.binance.com/api/v3/klines"
    params = {
        'symbol': symbol,
        'interval': interval,
        'limit': limit
    }

    response = requests.get(url, params=params)
    data = response.json()

    # Chuyển đổi sang DataFrame
    df = pd.DataFrame(data, columns=[
        'timestamp', 'open', 'high', 'low', 'close', 'volume',
        'close_time', 'quote_volume', 'trades', 'taker_buy_base',
        'taker_buy_quote', 'ignore'
    ])

    # Chuyển đổi kiểu dữ liệu
    df['timestamp'] = pd.to_datetime(df['timestamp'], unit='ms')
    for col in ['open', 'high', 'low', 'close', 'volume']:
        df[col] = df[col].astype(float)

    df.set_index('timestamp', inplace=True)
    return df[['open', 'high', 'low', 'close', 'volume']]

# Lấy dữ liệu BTC/USDT
btc_data = get_binance_data('BTCUSDT', interval='1d', limit=365)
print(btc_data.head())
Vẽ biểu đồ giá
Biểu đồ đường đơn giản
import matplotlib.pyplot as plt
import pandas as pd

# Lấy dữ liệu
ticker = yf.Ticker("AAPL")
data = ticker.history(period="6mo")

# Vẽ biểu đồ giá đóng cửa
plt.figure(figsize=(12, 6))
plt.plot(data.index, data['Close'], linewidth=2)
plt.title('Giá cổ phiếu Apple (AAPL)', fontsize=16, fontweight='bold')
plt.xlabel('Ngày')
plt.ylabel('Giá (USD)')
plt.grid(True, alpha=0.3)
plt.tight_layout()
plt.show()
Biểu đồ nến (Candlestick Chart)
import mplfinance as mpf

# Vẽ biểu đồ nến
mpf.plot(data,
         type='candle',
         style='yahoo',
         volume=True,
         title='Biểu đồ nến AAPL',
         figsize=(14, 8))
Các chỉ báo kỹ thuật phổ biến
Moving Average (Đường trung bình động)
Moving Average là một trong những chỉ báo kỹ thuật cơ bản nhất:
def calculate_ma(data, period=20):
    """
    Tính đường trung bình động đơn giản (SMA)
    """
    return data['Close'].rolling(window=period).mean()

# Tính SMA 20 và SMA 50
data['SMA_20'] = calculate_ma(data, 20)
data['SMA_50'] = calculate_ma(data, 50)

# Vẽ biểu đồ với SMA
plt.figure(figsize=(14, 8))
plt.plot(data.index, data['Close'], label='Giá đóng cửa', linewidth=2)
plt.plot(data.index, data['SMA_20'], label='SMA 20', linewidth=1.5)
plt.plot(data.index, data['SMA_50'], label='SMA 50', linewidth=1.5)
plt.title('Giá cổ phiếu với Moving Average', fontsize=16, fontweight='bold')
plt.xlabel('Ngày')
plt.ylabel('Giá (USD)')
plt.legend()
plt.grid(True, alpha=0.3)
plt.tight_layout()
plt.show()
Exponential Moving Average (EMA)
EMA cho trọng số cao hơn cho các giá trị gần đây:
def calculate_ema(data, period=20):
    """
    Tính đường trung bình động hàm mũ (EMA)
    """
    return data['Close'].ewm(span=period, adjust=False).mean()

# Tính EMA 12 và EMA 26
data['EMA_12'] = calculate_ema(data, 12)
data['EMA_26'] = calculate_ema(data, 26)
RSI (Relative Strength Index)
RSI đo lường sức mạnh của xu hướng giá:
def calculate_rsi(data, period=14):
    """
    Tính chỉ báo RSI (Relative Strength Index)
    """
    delta = data['Close'].diff()
    gain = (delta.where(delta > 0, 0)).rolling(window=period).mean()
    loss = (-delta.where(delta < 0, 0)).rolling(window=period).mean()

    rs = gain / loss
    rsi = 100 - (100 / (1 + rs))
    return rsi

# Tính RSI
data['RSI'] = calculate_rsi(data, 14)

# Vẽ biểu đồ RSI
fig, (ax1, ax2) = plt.subplots(2, 1, figsize=(14, 10), sharex=True)

# Biểu đồ giá
ax1.plot(data.index, data['Close'], label='Giá đóng cửa', linewidth=2)
ax1.set_title('Giá cổ phiếu', fontsize=14, fontweight='bold')
ax1.set_ylabel('Giá (USD)')
ax1.legend()
ax1.grid(True, alpha=0.3)

# Biểu đồ RSI
ax2.plot(data.index, data['RSI'], label='RSI', linewidth=2, color='purple')
ax2.axhline(y=70, color='r', linestyle='--', label='Overbought (70)')
ax2.axhline(y=30, color='g', linestyle='--', label='Oversold (30)')
ax2.set_title('RSI Indicator', fontsize=14, fontweight='bold')
ax2.set_xlabel('Ngày')
ax2.set_ylabel('RSI')
ax2.set_ylim(0, 100)
ax2.legend()
ax2.grid(True, alpha=0.3)

plt.tight_layout()
plt.show()
MACD (Moving Average Convergence Divergence)
MACD là chỉ báo xu hướng mạnh mẽ:
def calculate_macd(data, fast=12, slow=26, signal=9):
    """
    Tính chỉ báo MACD
    """
    ema_fast = calculate_ema(data, fast)
    ema_slow = calculate_ema(data, slow)

    macd_line = ema_fast - ema_slow
    signal_line = macd_line.ewm(span=signal, adjust=False).mean()
    histogram = macd_line - signal_line

    return macd_line, signal_line, histogram

# Tính MACD
data['MACD'], data['MACD_Signal'], data['MACD_Hist'] = calculate_macd(data)

# Vẽ biểu đồ MACD
fig, (ax1, ax2) = plt.subplots(2, 1, figsize=(14, 10), sharex=True)

# Biểu đồ giá
ax1.plot(data.index, data['Close'], label='Giá đóng cửa', linewidth=2)
ax1.set_title('Giá cổ phiếu', fontsize=14, fontweight='bold')
ax1.set_ylabel('Giá (USD)')
ax1.legend()
ax1.grid(True, alpha=0.3)

# Biểu đồ MACD
ax2.plot(data.index, data['MACD'], label='MACD', linewidth=2)
ax2.plot(data.index, data['MACD_Signal'], label='Signal', linewidth=2)
ax2.bar(data.index, data['MACD_Hist'], label='Histogram', alpha=0.3)
ax2.set_title('MACD Indicator', fontsize=14, fontweight='bold')
ax2.set_xlabel('Ngày')
ax2.set_ylabel('MACD')
ax2.legend()
ax2.grid(True, alpha=0.3)

plt.tight_layout()
plt.show()
Bollinger Bands
Bollinger Bands giúp xác định biến động giá:
def calculate_bollinger_bands(data, period=20, std_dev=2):
    """
    Tính Bollinger Bands
    """
    sma = calculate_ma(data, period)
    std = data['Close'].rolling(window=period).std()

    upper_band = sma + (std * std_dev)
    lower_band = sma - (std * std_dev)

    return upper_band, lower_band, sma

# Tính Bollinger Bands
data['BB_Upper'], data['BB_Lower'], data['BB_Middle'] = calculate_bollinger_bands(data)

# Vẽ biểu đồ Bollinger Bands
plt.figure(figsize=(14, 8))
plt.plot(data.index, data['Close'], label='Giá đóng cửa', linewidth=2)
plt.plot(data.index, data['BB_Upper'], label='Upper Band', linestyle='--', alpha=0.7)
plt.plot(data.index, data['BB_Lower'], label='Lower Band', linestyle='--', alpha=0.7)
plt.plot(data.index, data['BB_Middle'], label='Middle Band (SMA)', linestyle='--', alpha=0.7)
plt.fill_between(data.index, data['BB_Upper'], data['BB_Lower'], alpha=0.1)
plt.title('Bollinger Bands', fontsize=16, fontweight='bold')
plt.xlabel('Ngày')
plt.ylabel('Giá (USD)')
plt.legend()
plt.grid(True, alpha=0.3)
plt.tight_layout()
plt.show()
Xây dựng chiến lược giao dịch đơn giản
Chiến lược Moving Average Crossover
Chiến lược này mua khi SMA ngắn hạn cắt lên trên SMA dài hạn và bán khi ngược lại:
def ma_crossover_strategy(data, short_period=20, long_period=50):
    """
    Chiến lược giao dịch dựa trên Moving Average Crossover
    """
    # Tính SMA
    data['SMA_Short'] = calculate_ma(data, short_period)
    data['SMA_Long'] = calculate_ma(data, long_period)

    # Tạo tín hiệu
    data['Signal'] = 0
    data['Signal'][short_period:] = np.where(
        data['SMA_Short'][short_period:] > data['SMA_Long'][short_period:], 1, 0
    )

    # Tạo lệnh mua/bán
    data['Position'] = data['Signal'].diff()

    return data

# Áp dụng chiến lược
data = ma_crossover_strategy(data)

# Vẽ biểu đồ với tín hiệu
plt.figure(figsize=(14, 8))
plt.plot(data.index, data['Close'], label='Giá đóng cửa', linewidth=2)
plt.plot(data.index, data['SMA_20'], label='SMA 20', linewidth=1.5)
plt.plot(data.index, data['SMA_50'], label='SMA 50', linewidth=1.5)

# Đánh dấu điểm mua
buy_signals = data[data['Position'] == 1]
plt.scatter(buy_signals.index, buy_signals['Close'],
           marker='^', color='green', s=100, label='Tín hiệu MUA', zorder=5)

# Đánh dấu điểm bán
sell_signals = data[data['Position'] == -1]
plt.scatter(sell_signals.index, sell_signals['Close'],
           marker='v', color='red', s=100, label='Tín hiệu BÁN', zorder=5)

plt.title('Chiến lược Moving Average Crossover', fontsize=16, fontweight='bold')
plt.xlabel('Ngày')
plt.ylabel('Giá (USD)')
plt.legend()
plt.grid(True, alpha=0.3)
plt.tight_layout()
plt.show()
Backtesting chiến lược
Backtesting giúp đánh giá hiệu quả của chiến lược trên dữ liệu lịch sử:
def backtest_strategy(data, initial_capital=10000):
    """
    Backtest chiến lược giao dịch
    """
    capital = initial_capital
    position = 0  # Số lượng cổ phiếu đang nắm giữ
    trades = []

    for i in range(len(data)):
        if data['Position'].iloc[i] == 1:  # Tín hiệu mua
            if position == 0:  # Chưa có vị thế
                position = capital / data['Close'].iloc[i]
                capital = 0
                trades.append({
                    'date': data.index[i],
                    'action': 'BUY',
                    'price': data['Close'].iloc[i],
                    'shares': position
                })

        elif data['Position'].iloc[i] == -1:  # Tín hiệu bán
            if position > 0:  # Đang có vị thế
                capital = position * data['Close'].iloc[i]
                trades.append({
                    'date': data.index[i],
                    'action': 'SELL',
                    'price': data['Close'].iloc[i],
                    'shares': position
                })
                position = 0

    # Tính toán lợi nhuận cuối cùng
    if position > 0:
        final_capital = position * data['Close'].iloc[-1]
    else:
        final_capital = capital

    total_return = ((final_capital - initial_capital) / initial_capital) * 100

    return {
        'initial_capital': initial_capital,
        'final_capital': final_capital,
        'total_return': total_return,
        'trades': trades
    }

# Chạy backtest
results = backtest_strategy(data)
print(f"Vốn ban đầu: ${results['initial_capital']:,.2f}")
print(f"Vốn cuối cùng: ${results['final_capital']:,.2f}")
print(f"Lợi nhuận: {results['total_return']:.2f}%")
print(f"Số lần giao dịch: {len(results['trades'])}")
Ví dụ hoàn chỉnh: Phân tích cổ phiếu với nhiều chỉ báo
Dưới đây là một ví dụ hoàn chỉnh kết hợp nhiều chỉ báo kỹ thuật:
import yfinance as yf
import pandas as pd
import matplotlib.pyplot as plt
import numpy as np

# Lấy dữ liệu
ticker = yf.Ticker("AAPL")
data = ticker.history(period="1y")

# Tính các chỉ báo
data['SMA_20'] = calculate_ma(data, 20)
data['SMA_50'] = calculate_ma(data, 50)
data['RSI'] = calculate_rsi(data, 14)
data['MACD'], data['MACD_Signal'], data['MACD_Hist'] = calculate_macd(data)
data['BB_Upper'], data['BB_Lower'], data['BB_Middle'] = calculate_bollinger_bands(data)

# Vẽ biểu đồ tổng hợp
fig = plt.figure(figsize=(16, 12))

# Biểu đồ giá với Moving Average và Bollinger Bands
ax1 = plt.subplot(3, 1, 1)
ax1.plot(data.index, data['Close'], label='Giá đóng cửa', linewidth=2)
ax1.plot(data.index, data['SMA_20'], label='SMA 20', linewidth=1.5)
ax1.plot(data.index, data['SMA_50'], label='SMA 50', linewidth=1.5)
ax1.fill_between(data.index, data['BB_Upper'], data['BB_Lower'], alpha=0.1)
ax1.set_title('Phân tích kỹ thuật AAPL', fontsize=16, fontweight='bold')
ax1.set_ylabel('Giá (USD)')
ax1.legend()
ax1.grid(True, alpha=0.3)

# Biểu đồ RSI
ax2 = plt.subplot(3, 1, 2)
ax2.plot(data.index, data['RSI'], label='RSI', linewidth=2, color='purple')
ax2.axhline(y=70, color='r', linestyle='--', label='Overbought (70)')
ax2.axhline(y=30, color='g', linestyle='--', label='Oversold (30)')
ax2.set_ylabel('RSI')
ax2.set_ylim(0, 100)
ax2.legend()
ax2.grid(True, alpha=0.3)

# Biểu đồ MACD
ax3 = plt.subplot(3, 1, 3)
ax3.plot(data.index, data['MACD'], label='MACD', linewidth=2)
ax3.plot(data.index, data['MACD_Signal'], label='Signal', linewidth=2)
ax3.bar(data.index, data['MACD_Hist'], label='Histogram', alpha=0.3)
ax3.set_xlabel('Ngày')
ax3.set_ylabel('MACD')
ax3.legend()
ax3.grid(True, alpha=0.3)

plt.tight_layout()
plt.show()
Kết luận
Phân tích kỹ thuật với Python là một công cụ mạnh mẽ để phân tích thị trường tài chính. Với các thư viện như Pandas, NumPy, Matplotlib, và yfinance, bạn có thể:
- Lấy và xử lý dữ liệu giá từ nhiều nguồn
- Tính toán các chỉ báo kỹ thuật phổ biến
- Vẽ biểu đồ trực quan và chuyên nghiệp
- Xây dựng và backtest các chiến lược giao dịch
- Tự động hóa quy trình phân tích
Để tìm hiểu thêm về các thư viện Python trong giao dịch, bạn có thể xem bài viết Giới thiệu về Pandas hoặc Làm Bot Giao Dịch Backtest với Pandas. Nếu bạn muốn xây dựng chiến lược giao dịch định lượng hoàn chỉnh, hãy tham khảo bài viết Làm thế nào để sử dụng Python xây dựng chiến lược giao dịch định lượng.
Tài liệu tham khảo
Bài viết gần đây
-
Bot Auto Trading là gì? Hướng dẫn xây dựng bot thực chiến 2026
Tháng 8 2, 2026 -
Nhật ký vận hành Bot MT5: mẫu 7 ngày & khi nào phải dừng bot
Tháng 8 1, 2026 -
Cài MT5 trên VPS từ A→Z & giữ Terminal sống sau khi đóng RDP
Tháng 8 1, 2026
| Giới thiệu về Pandas
Được viết bởi thanhdt vào ngày 16/11/2025 lúc 10:22 | 155 lượt xem
Giới thiệu về Pandas
Pandas là gì?
Pandas là một thư viện Python mã nguồn mở, mạnh mẽ và linh hoạt được sử dụng để phân tích và thao tác dữ liệu. Tên “Pandas” được lấy từ thuật ngữ “Panel Data”, một khái niệm trong kinh tế lượng. Thư viện này được phát triển bởi Wes McKinney vào năm 2008 và đã trở thành công cụ không thể thiếu trong khoa học dữ liệu, phân tích dữ liệu và machine learning.
Nếu bạn mới bắt đầu với Python, hãy xem bài viết Phân tích kỹ thuật với Python để hiểu cách Python được sử dụng trong phân tích dữ liệu tài chính.
Tại sao sử dụng Pandas?
Pandas cung cấp các cấu trúc dữ liệu và công cụ phân tích hiệu quả, giúp việc làm việc với dữ liệu có cấu trúc trở nên dễ dàng và trực quan hơn so với việc sử dụng các thư viện cơ bản của Python như list hoặc dictionary. Một số lợi ích chính của Pandas bao gồm:
- Xử lý dữ liệu dễ dàng: Đọc và ghi dữ liệu từ nhiều định dạng khác nhau (CSV, Excel, JSON, SQL, HTML, v.v.)
- Làm sạch dữ liệu: Xử lý dữ liệu thiếu, loại bỏ trùng lặp, chuyển đổi kiểu dữ liệu
- Phân tích dữ liệu: Tính toán thống kê, nhóm dữ liệu, pivot tables
- Tích hợp tốt: Hoạt động tốt với các thư viện khác như NumPy, Matplotlib, Scikit-learn
- Hiệu suất cao: Được tối ưu hóa cho hiệu suất với các thao tác vectorized
So sánh Pandas và NumPy
Để hiểu rõ hơn về sự khác biệt giữa Pandas và NumPy, hãy xem bảng so sánh dưới đây:
| Tiêu chí | Pandas | NumPy |
|---|---|---|
| Kiểu dữ liệu | DataFrame, Series | Array (ndarray) |
| Mục tiêu | Phân tích dữ liệu có cấu trúc | Tính toán số học và đại số tuyến tính |
| Cú pháp | Dễ đọc, gần với SQL | Gọn nhẹ nhưng khó hơn |
| Dùng cho | Data Analyst, Data Scientist, ML Engineer | Scientific computing, Machine Learning |
| Xử lý dữ liệu thiếu | Có sẵn (NaN) | Không có sẵn |
| Nhãn dữ liệu | Có (index, column names) | Không có |
| Đọc file | Hỗ trợ nhiều định dạng (CSV, Excel, JSON) | Hạn chế |
| Tốc độ | Chậm hơn NumPy cho tính toán thuần | Nhanh hơn cho tính toán số học |
Pandas được xây dựng trên nền tảng NumPy, vì vậy chúng thường được sử dụng cùng nhau. Bạn có thể tìm hiểu thêm về NumPy trong phân tích dữ liệu tài chính để hiểu cách hai thư viện này bổ trợ cho nhau.
Cài đặt Pandas
Để cài đặt Pandas, bạn có thể sử dụng pip hoặc conda:
# Sử dụng pip
pip install pandas

# Sử dụng conda
conda install pandas
Cấu trúc dữ liệu chính trong Pandas
Series
Series là một cấu trúc dữ liệu một chiều, tương tự như một mảng hoặc danh sách có nhãn. Mỗi phần tử trong Series có một nhãn (index) tương ứng.
import pandas as pd

# Tạo Series từ list
data = [10, 20, 30, 40, 50]
series = pd.Series(data)
print(series)

# Tạo Series với index tùy chỉnh
series = pd.Series(data, index=['a', 'b', 'c', 'd', 'e'])
print(series)
DataFrame
DataFrame là cấu trúc dữ liệu hai chiều, tương tự như bảng tính Excel hoặc bảng SQL. Nó bao gồm các hàng và cột, mỗi cột có thể chứa các kiểu dữ liệu khác nhau.
# Tạo DataFrame từ dictionary
data = {
    'Tên': ['An', 'Bình', 'Chi', 'Dũng'],
    'Tuổi': [25, 30, 28, 35],
    'Thành phố': ['Hà Nội', 'TP.HCM', 'Đà Nẵng', 'Hà Nội']
}
df = pd.DataFrame(data)
print(df)
Đọc và ghi dữ liệu
Đọc dữ liệu từ file CSV
# Đọc file CSV
df = pd.read_csv('data.csv')

# Đọc với các tùy chọn
df = pd.read_csv('data.csv', encoding='utf-8', sep=',', header=0)
Đọc dữ liệu từ file Excel
# Đọc file Excel
df = pd.read_excel('data.xlsx', sheet_name='Sheet1')
Đọc dữ liệu từ JSON
# Đọc file JSON
df = pd.read_json('data.json')
Ghi dữ liệu ra file
# Ghi ra file CSV
df.to_csv('output.csv', index=False)

# Ghi ra file Excel
df.to_excel('output.xlsx', index=False)

# Ghi ra file JSON
df.to_json('output.json', orient='records')
Xem và khám phá dữ liệu
Xem thông tin cơ bản về DataFrame
# Xem 5 dòng đầu tiên
df.head()

# Xem 5 dòng cuối cùng
df.tail()

# Xem thông tin tổng quan
df.info()

# Xem thống kê mô tả
df.describe()

# Xem hình dạng của DataFrame (số hàng, số cột)
df.shape

# Xem tên các cột
df.columns

# Xem index
df.index
Lựa chọn dữ liệu
Lựa chọn cột
# Lựa chọn một cột
df['Tên']

# Lựa chọn nhiều cột
df[['Tên', 'Tuổi']]
Lựa chọn hàng
# Lựa chọn hàng theo index
df.iloc[0]  # Hàng đầu tiên
df.iloc[0:3]  # 3 hàng đầu tiên

# Lựa chọn hàng theo điều kiện
df[df['Tuổi'] > 25]

# Lựa chọn hàng theo label
df.loc[0]
Lọc dữ liệu
# Lọc với một điều kiện
df[df['Tuổi'] > 30]

# Lọc với nhiều điều kiện
df[(df['Tuổi'] > 25) & (df['Thành phố'] == 'Hà Nội')]

# Sử dụng query
df.query('Tuổi > 25 and Thành_phố == "Hà Nội"')
Xử lý dữ liệu thiếu
# Kiểm tra dữ liệu thiếu
df.isnull()
df.isnull().sum()

# Xóa các hàng có dữ liệu thiếu
df.dropna()

# Điền dữ liệu thiếu
df.fillna(0)  # Điền bằng 0
df.fillna(df.mean())  # Điền bằng giá trị trung bình
df.fillna(method='ffill')  # Điền bằng giá trị trước đó
Thao tác với dữ liệu
Thêm cột mới
# Thêm cột từ phép tính
df['Tuổi_mới'] = df['Tuổi'] + 1

# Thêm cột với giá trị cố định
df['Nhóm'] = 'A'
Xóa cột hoặc hàng
# Xóa cột
df.drop('Tên', axis=1, inplace=True)

# Xóa hàng
df.drop(0, axis=0, inplace=True)
Sắp xếp dữ liệu
# Sắp xếp theo cột
df.sort_values('Tuổi', ascending=False)

# Sắp xếp theo nhiều cột
df.sort_values(['Thành phố', 'Tuổi'])
Nhóm dữ liệu (Grouping)
# Nhóm theo một cột
df.groupby('Thành phố').mean()

# Nhóm theo nhiều cột
df.groupby(['Thành phố', 'Nhóm']).sum()

# Áp dụng nhiều hàm thống kê
df.groupby('Thành phố').agg({
    'Tuổi': ['mean', 'min', 'max'],
    'Điểm': 'sum'
})
Kết hợp dữ liệu
Nối dữ liệu theo chiều dọc (Concatenate)
# Nối hai DataFrame
df_combined = pd.concat([df1, df2], ignore_index=True)
Nối dữ liệu theo chiều ngang (Merge)
# Merge giống như JOIN trong SQL
df_merged = pd.merge(df1, df2, on='ID', how='inner')

# Các loại merge: 'inner', 'left', 'right', 'outer'
Thống kê và tính toán
# Tính tổng
df['Tuổi'].sum()

# Tính trung bình
df['Tuổi'].mean()

# Tính trung vị
df['Tuổi'].median()

# Tính độ lệch chuẩn
df['Tuổi'].std()

# Đếm số lượng
df['Thành phố'].value_counts()

# Tương quan
df.corr()
Áp dụng hàm tùy chỉnh
# Áp dụng hàm cho từng phần tử
df['Tuổi'].apply(lambda x: x * 2)

# Áp dụng hàm cho từng hàng
df.apply(lambda row: row['Tuổi'] + row['Điểm'], axis=1)

# Áp dụng hàm cho từng cột
df.apply(lambda col: col.max(), axis=0)
Xử lý chuỗi thời gian
Pandas cung cấp các công cụ mạnh mẽ để làm việc với dữ liệu thời gian:
# Chuyển đổi cột thành datetime
df['Ngày'] = pd.to_datetime(df['Ngày'])

# Lấy năm, tháng, ngày
df['Năm'] = df['Ngày'].dt.year
df['Tháng'] = df['Ngày'].dt.month

# Resample dữ liệu theo thời gian
df.set_index('Ngày').resample('M').mean()
Ví dụ thực tế
Dưới đây là một ví dụ hoàn chỉnh về cách sử dụng Pandas để phân tích dữ liệu. Bạn cũng có thể tham khảo bài viết Làm Bot Giao Dịch Backtest với Pandas để xem cách áp dụng Pandas trong thực tế cho giao dịch tài chính:
import pandas as pd

# Đọc dữ liệu
df = pd.read_csv('sales_data.csv')

# Xem thông tin cơ bản
print(df.head())
print(df.info())

# Làm sạch dữ liệu
df = df.dropna()  # Xóa dữ liệu thiếu
df = df.drop_duplicates()  # Xóa dữ liệu trùng lặp

# Phân tích
total_sales = df['Doanh_thu'].sum()
avg_sales = df['Doanh_thu'].mean()
sales_by_region = df.groupby('Khu_vực')['Doanh_thu'].sum()

# Lọc dữ liệu
high_sales = df[df['Doanh_thu'] > 1000000]

# Sắp xếp
top_products = df.sort_values('Doanh_thu', ascending=False).head(10)

# Xuất kết quả
df.to_csv('cleaned_data.csv', index=False)
Kết luận
Pandas là một thư viện không thể thiếu cho bất kỳ ai làm việc với dữ liệu trong Python. Với các tính năng mạnh mẽ và dễ sử dụng, Pandas giúp bạn xử lý, phân tích và khám phá dữ liệu một cách hiệu quả. Cho dù bạn đang làm việc với dữ liệu nhỏ hay lớn, Pandas cung cấp các công cụ cần thiết để biến dữ liệu thô thành thông tin có ý nghĩa.
Để tìm hiểu thêm về các thư viện Python khác trong giao dịch định lượng, bạn có thể xem bài viết Các thư viện Python phổ biến trong giao dịch định lượng hoặc Làm thế nào để sử dụng Python xây dựng chiến lược giao dịch định lượng.
Tài liệu tham khảo
Bài viết gần đây
-
Bot Auto Trading là gì? Hướng dẫn xây dựng bot thực chiến 2026
Tháng 8 2, 2026 -
Nhật ký vận hành Bot MT5: mẫu 7 ngày & khi nào phải dừng bot
Tháng 8 1, 2026 -
Cài MT5 trên VPS từ A→Z & giữ Terminal sống sau khi đóng RDP
Tháng 8 1, 2026
| Tính Toán Chỉ Báo Trong Forex MT5 Với Python Cho Bot Auto Trading
Được viết bởi thanhdt vào ngày 15/11/2025 lúc 21:50 | 178 lượt xem
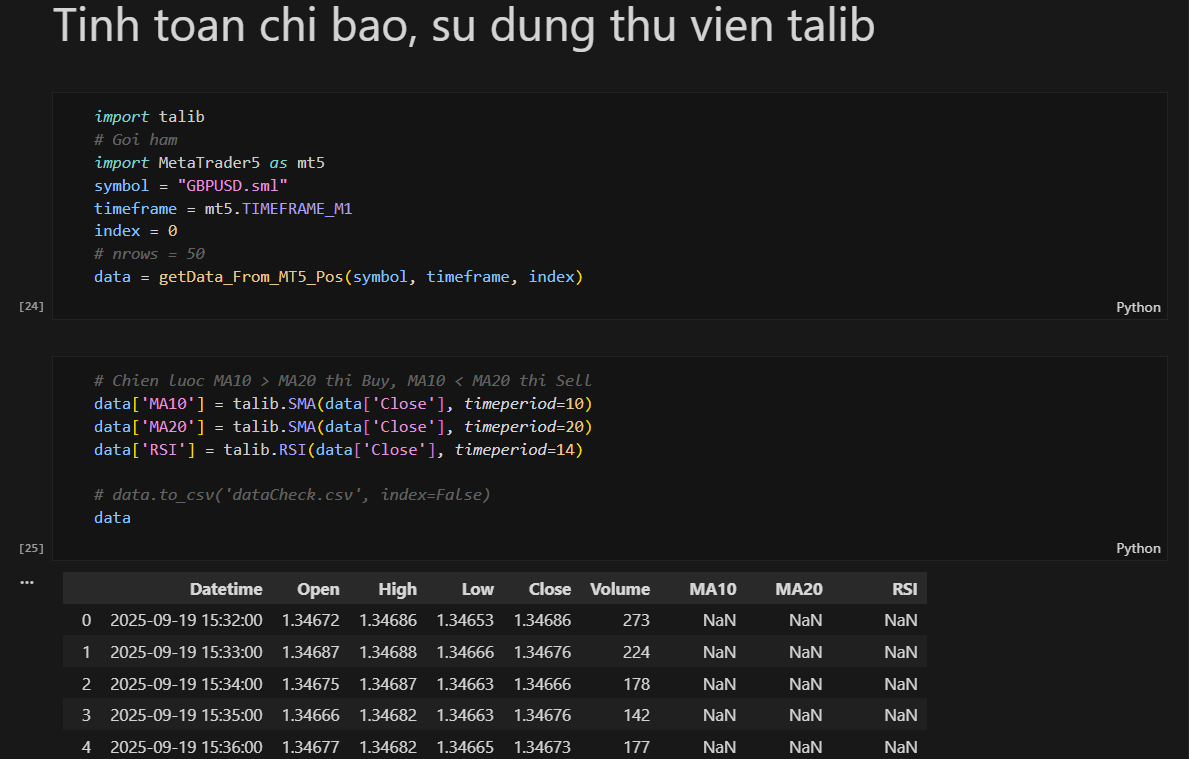
Hướng dẫn chi tiết cách tính toán các chỉ báo kỹ thuật trong Forex MT5 với Python để sử dụng trong bot auto trading
Tính Toán Chỉ Báo Trong Forex MT5 Với Python Cho Bot Auto Trading
Tính toán chỉ báo kỹ thuật là bước quan trọng trong việc xây dựng bot auto trading. Bài viết này sẽ hướng dẫn bạn cách tính toán các chỉ báo kỹ thuật từ dữ liệu MT5 bằng Python để sử dụng trong bot giao dịch tự động.
Chuẩn Bị
import MetaTrader5 as mt5
import pandas as pd
import numpy as np
from datetime import datetime

# Kết nối với MT5
if not mt5.initialize():
    print("Khởi tạo MT5 thất bại")
    exit()

# Hàm lấy dữ liệu
def get_rates(symbol, timeframe, count=1000):
    """Lấy dữ liệu OHLC từ MT5"""
    rates = mt5.copy_rates_from_pos(symbol, timeframe, 0, count)
    if rates is None:
        return None
    df = pd.DataFrame(rates)
    df['time'] = pd.to_datetime(df['time'], unit='s')
    return df
Moving Average (MA)
Simple Moving Average (SMA)
def calculate_sma(data, period):
    """
    Tính Simple Moving Average

    Args:
        data: Series hoặc array chứa giá
        period: Chu kỳ

    Returns:
        Series: SMA values
    """
    return data.rolling(window=period).mean()

# Sử dụng
rates = get_rates("EURUSD", mt5.TIMEFRAME_H1, count=200)
if rates is not None:
    rates['SMA20'] = calculate_sma(rates['close'], 20)
    rates['SMA50'] = calculate_sma(rates['close'], 50)
    print(rates[['time', 'close', 'SMA20', 'SMA50']].tail())
Exponential Moving Average (EMA)
def calculate_ema(data, period):
    """
    Tính Exponential Moving Average

    Args:
        data: Series hoặc array chứa giá
        period: Chu kỳ

    Returns:
        Series: EMA values
    """
    return data.ewm(span=period, adjust=False).mean()

# Sử dụng
rates = get_rates("EURUSD", mt5.TIMEFRAME_H1, count=200)
if rates is not None:
    rates['EMA12'] = calculate_ema(rates['close'], 12)
    rates['EMA26'] = calculate_ema(rates['close'], 26)
    print(rates[['time', 'close', 'EMA12', 'EMA26']].tail())
Weighted Moving Average (WMA)
def calculate_wma(data, period):
    """
    Tính Weighted Moving Average

    Args:
        data: Series hoặc array chứa giá
        period: Chu kỳ

    Returns:
        Series: WMA values
    """
    weights = np.arange(1, period + 1)
    return data.rolling(window=period).apply(
        lambda x: np.dot(x, weights) / weights.sum(), raw=True
    )

# Sử dụng
rates = get_rates("EURUSD", mt5.TIMEFRAME_H1, count=200)
if rates is not None:
    rates['WMA20'] = calculate_wma(rates['close'], 20)
RSI (Relative Strength Index)
def calculate_rsi(data, period=14):
    """
    Tính RSI (Relative Strength Index)

    Args:
        data: Series chứa giá close
        period: Chu kỳ (mặc định 14)

    Returns:
        Series: RSI values (0-100)
    """
    delta = data.diff()

    gain = (delta.where(delta > 0, 0)).rolling(window=period).mean()
    loss = (-delta.where(delta < 0, 0)).rolling(window=period).mean()

    rs = gain / loss
    rsi = 100 - (100 / (1 + rs))

    return rsi

# Sử dụng
rates = get_rates("EURUSD", mt5.TIMEFRAME_H1, count=200)
if rates is not None:
    rates['RSI'] = calculate_rsi(rates['close'], period=14)

    # Tín hiệu giao dịch
    rates['RSI_Overbought'] = rates['RSI'] > 70
    rates['RSI_Oversold'] = rates['RSI'] < 30

    print(rates[['time', 'close', 'RSI', 'RSI_Overbought', 'RSI_Oversold']].tail())
MACD (Moving Average Convergence Divergence)
def calculate_macd(data, fast_period=12, slow_period=26, signal_period=9):
    """
    Tính MACD

    Args:
        data: Series chứa giá close
        fast_period: Chu kỳ EMA nhanh (mặc định 12)
        slow_period: Chu kỳ EMA chậm (mặc định 26)
        signal_period: Chu kỳ signal line (mặc định 9)

    Returns:
        dict: Dictionary chứa MACD line, signal line, và histogram
    """
    ema_fast = calculate_ema(data, fast_period)
    ema_slow = calculate_ema(data, slow_period)

    macd_line = ema_fast - ema_slow
    signal_line = calculate_ema(macd_line, signal_period)
    histogram = macd_line - signal_line

    return {
        'macd': macd_line,
        'signal': signal_line,
        'histogram': histogram
    }

# Sử dụng
rates = get_rates("EURUSD", mt5.TIMEFRAME_H1, count=200)
if rates is not None:
    macd_data = calculate_macd(rates['close'])
    rates['MACD'] = macd_data['macd']
    rates['MACD_Signal'] = macd_data['signal']
    rates['MACD_Histogram'] = macd_data['histogram']

    # Tín hiệu giao dịch
    rates['MACD_Buy'] = (rates['MACD'] > rates['MACD_Signal']) & \
                        (rates['MACD'].shift(1) <= rates['MACD_Signal'].shift(1))
    rates['MACD_Sell'] = (rates['MACD'] < rates['MACD_Signal']) & \
                         (rates['MACD'].shift(1) >= rates['MACD_Signal'].shift(1))

    print(rates[['time', 'close', 'MACD', 'MACD_Signal', 'MACD_Buy', 'MACD_Sell']].tail())
Bollinger Bands
def calculate_bollinger_bands(data, period=20, num_std=2):
    """
    Tính Bollinger Bands

    Args:
        data: Series chứa giá close
        period: Chu kỳ (mặc định 20)
        num_std: Số độ lệch chuẩn (mặc định 2)

    Returns:
        dict: Dictionary chứa upper band, middle band (SMA), và lower band
    """
    sma = calculate_sma(data, period)
    std = data.rolling(window=period).std()

    upper_band = sma + (num_std * std)
    lower_band = sma - (num_std * std)

    return {
        'upper': upper_band,
        'middle': sma,
        'lower': lower_band
    }

# Sử dụng
rates = get_rates("EURUSD", mt5.TIMEFRAME_H1, count=200)
if rates is not None:
    bb = calculate_bollinger_bands(rates['close'], period=20, num_std=2)
    rates['BB_Upper'] = bb['upper']
    rates['BB_Middle'] = bb['middle']
    rates['BB_Lower'] = bb['lower']

    # Tín hiệu giao dịch
    rates['BB_Buy'] = rates['close'] < rates['BB_Lower']  # Giá chạm lower band
    rates['BB_Sell'] = rates['close'] > rates['BB_Upper']  # Giá chạm upper band

    print(rates[['time', 'close', 'BB_Upper', 'BB_Middle', 'BB_Lower', 'BB_Buy', 'BB_Sell']].tail())
Stochastic Oscillator
def calculate_stochastic(high, low, close, k_period=14, d_period=3):
    """
    Tính Stochastic Oscillator

    Args:
        high: Series chứa giá high
        low: Series chứa giá low
        close: Series chứa giá close
        k_period: Chu kỳ %K (mặc định 14)
        d_period: Chu kỳ %D (mặc định 3)

    Returns:
        dict: Dictionary chứa %K và %D
    """
    lowest_low = low.rolling(window=k_period).min()
    highest_high = high.rolling(window=k_period).max()

    k_percent = 100 * ((close - lowest_low) / (highest_high - lowest_low))
    d_percent = k_percent.rolling(window=d_period).mean()

    return {
        'k': k_percent,
        'd': d_percent
    }

# Sử dụng
rates = get_rates("EURUSD", mt5.TIMEFRAME_H1, count=200)
if rates is not None:
    stoch = calculate_stochastic(rates['high'], rates['low'], rates['close'])
    rates['Stoch_K'] = stoch['k']
    rates['Stoch_D'] = stoch['d']

    # Tín hiệu giao dịch
    rates['Stoch_Buy'] = (rates['Stoch_K'] < 20) & (rates['Stoch_K'] > rates['Stoch_D'])
    rates['Stoch_Sell'] = (rates['Stoch_K'] > 80) & (rates['Stoch_K'] < rates['Stoch_D'])

    print(rates[['time', 'close', 'Stoch_K', 'Stoch_D', 'Stoch_Buy', 'Stoch_Sell']].tail())
ATR (Average True Range)
def calculate_atr(high, low, close, period=14):
    """
    Tính ATR (Average True Range)

    Args:
        high: Series chứa giá high
        low: Series chứa giá low
        close: Series chứa giá close
        period: Chu kỳ (mặc định 14)

    Returns:
        Series: ATR values
    """
    high_low = high - low
    high_close = np.abs(high - close.shift())
    low_close = np.abs(low - close.shift())

    true_range = pd.concat([high_low, high_close, low_close], axis=1).max(axis=1)
    atr = true_range.rolling(window=period).mean()

    return atr

# Sử dụng
rates = get_rates("EURUSD", mt5.TIMEFRAME_H1, count=200)
if rates is not None:
    rates['ATR'] = calculate_atr(rates['high'], rates['low'], rates['close'], period=14)

    # Sử dụng ATR để tính stop loss
    current_price = rates['close'].iloc[-1]
    current_atr = rates['ATR'].iloc[-1]
    stop_loss_long = current_price - (2 * current_atr)
    stop_loss_short = current_price + (2 * current_atr)

    print(f"Current Price: {current_price:.5f}")
    print(f"ATR: {current_atr:.5f}")
    print(f"Stop Loss Long: {stop_loss_long:.5f}")
    print(f"Stop Loss Short: {stop_loss_short:.5f}")
ADX (Average Directional Index)
def calculate_adx(high, low, close, period=14):
    """
    Tính ADX (Average Directional Index)

    Args:
        high: Series chứa giá high
        low: Series chứa giá low
        close: Series chứa giá close
        period: Chu kỳ (mặc định 14)

    Returns:
        dict: Dictionary chứa ADX, +DI, và -DI
    """
    # Tính True Range
    atr = calculate_atr(high, low, close, period)

    # Tính +DM và -DM
    plus_dm = high.diff()
    minus_dm = -low.diff()

    plus_dm[plus_dm < 0] = 0
    minus_dm[minus_dm < 0] = 0

    # Tính +DI và -DI
    plus_di = 100 * (plus_dm.rolling(window=period).mean() / atr)
    minus_di = 100 * (minus_dm.rolling(window=period).mean() / atr)

    # Tính DX
    dx = 100 * np.abs(plus_di - minus_di) / (plus_di + minus_di)

    # Tính ADX
    adx = dx.rolling(window=period).mean()

    return {
        'adx': adx,
        'plus_di': plus_di,
        'minus_di': minus_di
    }

# Sử dụng
rates = get_rates("EURUSD", mt5.TIMEFRAME_H1, count=200)
if rates is not None:
    adx_data = calculate_adx(rates['high'], rates['low'], rates['close'])
    rates['ADX'] = adx_data['adx']
    rates['Plus_DI'] = adx_data['plus_di']
    rates['Minus_DI'] = adx_data['minus_di']

    # Tín hiệu giao dịch (ADX > 25 = xu hướng mạnh)
    rates['ADX_Strong'] = rates['ADX'] > 25
    rates['ADX_Buy'] = (rates['ADX'] > 25) & (rates['Plus_DI'] > rates['Minus_DI'])
    rates['ADX_Sell'] = (rates['ADX'] > 25) & (rates['Plus_DI'] < rates['Minus_DI'])

    print(rates[['time', 'close', 'ADX', 'Plus_DI', 'Minus_DI', 'ADX_Buy', 'ADX_Sell']].tail())
CCI (Commodity Channel Index)
def calculate_cci(high, low, close, period=20):
    """
    Tính CCI (Commodity Channel Index)

    Args:
        high: Series chứa giá high
        low: Series chứa giá low
        close: Series chứa giá close
        period: Chu kỳ (mặc định 20)

    Returns:
        Series: CCI values
    """
    typical_price = (high + low + close) / 3
    sma_tp = typical_price.rolling(window=period).mean()
    mean_deviation = typical_price.rolling(window=period).apply(
        lambda x: np.mean(np.abs(x - x.mean())), raw=True
    )

    cci = (typical_price - sma_tp) / (0.015 * mean_deviation)

    return cci

# Sử dụng
rates = get_rates("EURUSD", mt5.TIMEFRAME_H1, count=200)
if rates is not None:
    rates['CCI'] = calculate_cci(rates['high'], rates['low'], rates['close'], period=20)

    # Tín hiệu giao dịch
    rates['CCI_Buy'] = rates['CCI'] < -100  # Oversold
    rates['CCI_Sell'] = rates['CCI'] > 100   # Overbought

    print(rates[['time', 'close', 'CCI', 'CCI_Buy', 'CCI_Sell']].tail())
Williams %R
def calculate_williams_r(high, low, close, period=14):
    """
    Tính Williams %R

    Args:
        high: Series chứa giá high
        low: Series chứa giá low
        close: Series chứa giá close
        period: Chu kỳ (mặc định 14)

    Returns:
        Series: Williams %R values (-100 to 0)
    """
    highest_high = high.rolling(window=period).max()
    lowest_low = low.rolling(window=period).min()

    williams_r = -100 * ((highest_high - close) / (highest_high - lowest_low))

    return williams_r

# Sử dụng
rates = get_rates("EURUSD", mt5.TIMEFRAME_H1, count=200)
if rates is not None:
    rates['Williams_R'] = calculate_williams_r(rates['high'], rates['low'], rates['close'])

    # Tín hiệu giao dịch
    rates['Williams_Buy'] = rates['Williams_R'] < -80  # Oversold
    rates['Williams_Sell'] = rates['Williams_R'] > -20  # Overbought

    print(rates[['time', 'close', 'Williams_R', 'Williams_Buy', 'Williams_Sell']].tail())
Class Quản Lý Chỉ Báo
class MT5IndicatorCalculator:
    """Class quản lý tính toán chỉ báo từ dữ liệu MT5"""

    def __init__(self, symbol, timeframe):
        """
        Khởi tạo

        Args:
            symbol: Tên symbol
            timeframe: Khung thời gian
        """
        self.symbol = symbol
        self.timeframe = timeframe
        self.data = None

    def load_data(self, count=1000):
        """Tải dữ liệu từ MT5"""
        self.data = get_rates(self.symbol, self.timeframe, count=count)
        return self.data is not None

    def calculate_all_indicators(self):
        """Tính tất cả các chỉ báo"""
        if self.data is None:
            print("Chưa có dữ liệu. Gọi load_data() trước.")
            return

        # Moving Averages
        self.data['SMA20'] = calculate_sma(self.data['close'], 20)
        self.data['SMA50'] = calculate_sma(self.data['close'], 50)
        self.data['EMA12'] = calculate_ema(self.data['close'], 12)
        self.data['EMA26'] = calculate_ema(self.data['close'], 26)

        # RSI
        self.data['RSI'] = calculate_rsi(self.data['close'], 14)

        # MACD
        macd_data = calculate_macd(self.data['close'])
        self.data['MACD'] = macd_data['macd']
        self.data['MACD_Signal'] = macd_data['signal']
        self.data['MACD_Histogram'] = macd_data['histogram']

        # Bollinger Bands
        bb = calculate_bollinger_bands(self.data['close'])
        self.data['BB_Upper'] = bb['upper']
        self.data['BB_Middle'] = bb['middle']
        self.data['BB_Lower'] = bb['lower']

        # Stochastic
        stoch = calculate_stochastic(self.data['high'], self.data['low'], self.data['close'])
        self.data['Stoch_K'] = stoch['k']
        self.data['Stoch_D'] = stoch['d']

        # ATR
        self.data['ATR'] = calculate_atr(self.data['high'], self.data['low'], self.data['close'])

        # ADX
        adx_data = calculate_adx(self.data['high'], self.data['low'], self.data['close'])
        self.data['ADX'] = adx_data['adx']
        self.data['Plus_DI'] = adx_data['plus_di']
        self.data['Minus_DI'] = adx_data['minus_di']

        # CCI
        self.data['CCI'] = calculate_cci(self.data['high'], self.data['low'], self.data['close'])

        # Williams %R
        self.data['Williams_R'] = calculate_williams_r(self.data['high'], self.data['low'], self.data['close'])

    def get_signals(self):
        """Lấy tín hiệu giao dịch từ các chỉ báo"""
        if self.data is None:
            return None

        latest = self.data.iloc[-1]

        signals = {
            'buy_signals': 0,
            'sell_signals': 0,
            'indicators': {}
        }

        # RSI
        if latest['RSI'] < 30:
            signals['buy_signals'] += 1
            signals['indicators']['RSI'] = 'BUY'
        elif latest['RSI'] > 70:
            signals['sell_signals'] += 1
            signals['indicators']['RSI'] = 'SELL'

        # MACD
        if latest['MACD'] > latest['MACD_Signal']:
            signals['buy_signals'] += 1
            signals['indicators']['MACD'] = 'BUY'
        else:
            signals['sell_signals'] += 1
            signals['indicators']['MACD'] = 'SELL'

        # Bollinger Bands
        if latest['close'] < latest['BB_Lower']:
            signals['buy_signals'] += 1
            signals['indicators']['BB'] = 'BUY'
        elif latest['close'] > latest['BB_Upper']:
            signals['sell_signals'] += 1
            signals['indicators']['BB'] = 'SELL'

        # Stochastic
        if latest['Stoch_K'] < 20 and latest['Stoch_K'] > latest['Stoch_D']:
            signals['buy_signals'] += 1
            signals['indicators']['Stoch'] = 'BUY'
        elif latest['Stoch_K'] > 80 and latest['Stoch_K'] < latest['Stoch_D']:
            signals['sell_signals'] += 1
            signals['indicators']['Stoch'] = 'SELL'

        return signals

# Sử dụng
calculator = MT5IndicatorCalculator("EURUSD", mt5.TIMEFRAME_H1)
if calculator.load_data(count=200):
    calculator.calculate_all_indicators()
    signals = calculator.get_signals()
    print(f"Buy Signals: {signals['buy_signals']}")
    print(f"Sell Signals: {signals['sell_signals']}")
    print(f"Indicators: {signals['indicators']}")
Tích Hợp Vào Bot Auto Trading
Hàm Tạo Tín Hiệu Giao Dịch
def generate_trading_signals(symbol, timeframe):
    """
    Tạo tín hiệu giao dịch từ các chỉ báo

    Args:
        symbol: Tên symbol
        timeframe: Khung thời gian

    Returns:
        dict: Dictionary chứa tín hiệu giao dịch
    """
    calculator = MT5IndicatorCalculator(symbol, timeframe)

    if not calculator.load_data(count=200):
        return None

    calculator.calculate_all_indicators()
    signals = calculator.get_signals()

    latest = calculator.data.iloc[-1]

    # Quyết định giao dịch
    action = 'HOLD'
    confidence = 0

    if signals['buy_signals'] > signals['sell_signals']:
        action = 'BUY'
        confidence = signals['buy_signals'] / (signals['buy_signals'] + signals['sell_signals'])
    elif signals['sell_signals'] > signals['buy_signals']:
        action = 'SELL'
        confidence = signals['sell_signals'] / (signals['buy_signals'] + signals['sell_signals'])

    return {
        'symbol': symbol,
        'action': action,
        'confidence': confidence,
        'price': latest['close'],
        'signals': signals,
        'indicators': {
            'RSI': latest['RSI'],
            'MACD': latest['MACD'],
            'ADX': latest['ADX'],
            'ATR': latest['ATR']
        }
    }

# Sử dụng
signal = generate_trading_signals("EURUSD", mt5.TIMEFRAME_H1)
if signal:
    print(f"Symbol: {signal['symbol']}")
    print(f"Action: {signal['action']}")
    print(f"Confidence: {signal['confidence']:.2%}")
    print(f"Price: {signal['price']:.5f}")
    print(f"RSI: {signal['indicators']['RSI']:.2f}")
    print(f"ADX: {signal['indicators']['ADX']:.2f}")
Hàm Tính Stop Loss và Take Profit
def calculate_stop_loss_take_profit(price, atr, direction='BUY', risk_reward_ratio=2):
    """
    Tính Stop Loss và Take Profit dựa trên ATR

    Args:
        price: Giá vào lệnh
        atr: Giá trị ATR
        direction: Hướng giao dịch ('BUY' hoặc 'SELL')
        risk_reward_ratio: Tỷ lệ Risk/Reward (mặc định 2)

    Returns:
        dict: Dictionary chứa stop loss và take profit
    """
    if direction == 'BUY':
        stop_loss = price - (2 * atr)
        take_profit = price + (2 * atr * risk_reward_ratio)
    else:  # SELL
        stop_loss = price + (2 * atr)
        take_profit = price - (2 * atr * risk_reward_ratio)

    return {
        'stop_loss': stop_loss,
        'take_profit': take_profit,
        'risk': abs(price - stop_loss),
        'reward': abs(take_profit - price)
    }

# Sử dụng
rates = get_rates("EURUSD", mt5.TIMEFRAME_H1, count=200)
if rates is not None:
    rates['ATR'] = calculate_atr(rates['high'], rates['low'], rates['close'])

    current_price = rates['close'].iloc[-1]
    current_atr = rates['ATR'].iloc[-1]

    sl_tp = calculate_stop_loss_take_profit(current_price, current_atr, direction='BUY')
    print(f"Price: {current_price:.5f}")
    print(f"Stop Loss: {sl_tp['stop_loss']:.5f}")
    print(f"Take Profit: {sl_tp['take_profit']:.5f}")
    print(f"Risk: {sl_tp['risk']:.5f}")
    print(f"Reward: {sl_tp['reward']:.5f}")
    print(f"Risk/Reward Ratio: {sl_tp['risk']/sl_tp['reward']:.2f}")
Kết Luận
Bài viết đã hướng dẫn cách tính toán các chỉ báo kỹ thuật trong Forex MT5 với Python để sử dụng trong bot auto trading. Các chỉ báo bao gồm:
- Moving Averages (SMA, EMA, WMA)
- RSI (Relative Strength Index)
- MACD (Moving Average Convergence Divergence)
- Bollinger Bands
- Stochastic Oscillator
- ATR (Average True Range)
- ADX (Average Directional Index)
- CCI (Commodity Channel Index)
- Williams %R
Lưu ý quan trọng:
- Luôn kết hợp nhiều chỉ báo để tăng độ chính xác
- Sử dụng ATR để tính stop loss và take profit động
- Backtest chiến lược trước khi sử dụng trên tài khoản thật
- Quản lý rủi ro cẩn thận
Tài Liệu Tham Khảo
- MetaTrader5 Python Documentation
- Cách Viết Hàm Để Lấy Dữ Liệu Thị Trường Forex MT5 Bằng Python
- NumPy Được Sử Dụng Trong Phân Tích Dữ Liệu Tài Chính
- Xây Dựng Bot Auto Trading Cho Forex MT5
Bài viết được biên soạn bởi CoinGetMarket – Nền tảng giáo dục về crypto và trading bot.
Bài viết gần đây
-
Bot Auto Trading là gì? Hướng dẫn xây dựng bot thực chiến 2026
Tháng 8 2, 2026 -
Nhật ký vận hành Bot MT5: mẫu 7 ngày & khi nào phải dừng bot
Tháng 8 1, 2026 -
Cài MT5 trên VPS từ A→Z & giữ Terminal sống sau khi đóng RDP
Tháng 8 1, 2026
| Cách Viết Hàm Để Lấy Dữ Liệu Thị Trường Forex MT5 Bằng Python
Được viết bởi thanhdt vào ngày 15/11/2025 lúc 21:42 | 213 lượt xem
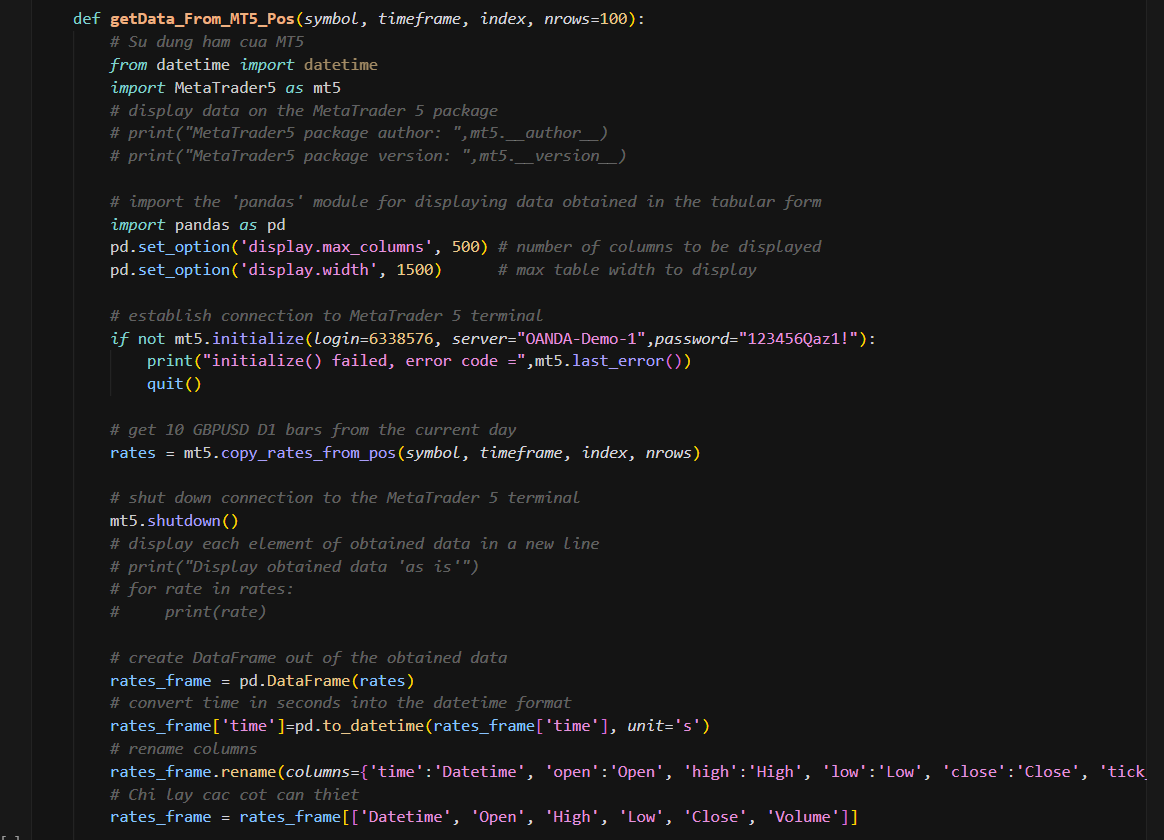
Hướng dẫn chi tiết cách viết hàm để lấy dữ liệu thị trường Forex từ MetaTrader 5 bằng Python, bao gồm giá real-time, dữ liệu lịch sử và tick data.
Cách Viết Hàm Để Lấy Dữ Liệu Thị Trường Forex MT5 Bằng Python
Lấy dữ liệu thị trường là bước quan trọng trong phân tích và giao dịch tự động. Bài viết này sẽ hướng dẫn bạn cách viết các hàm để lấy dữ liệu thị trường Forex từ MetaTrader 5 bằng Python.
Cài Đặt và Kết Nối
import MetaTrader5 as mt5
import pandas as pd
from datetime import datetime, timedelta

# Kết nối với MT5
def connect_mt5():
    """Kết nối với MetaTrader 5"""
    if not mt5.initialize():
        print("Khởi tạo MT5 thất bại, error code =", mt5.last_error())
        return False
    return True

# Sử dụng
if not connect_mt5():
    exit()
Lấy Giá Real-Time
Hàm Lấy Giá Bid/Ask
def get_symbol_info(symbol):
    """
    Lấy thông tin symbol

    Args:
        symbol: Tên symbol (ví dụ: "EURUSD")

    Returns:
        dict: Dictionary chứa thông tin symbol hoặc None nếu lỗi
    """
    symbol_info = mt5.symbol_info(symbol)

    if symbol_info is None:
        print(f"Không tìm thấy symbol {symbol}, error code =", mt5.last_error())
        return None

    if not symbol_info.visible:
        print(f"Symbol {symbol} không hiển thị, đang thử kích hoạt...")
        if not mt5.symbol_select(symbol, True):
            print(f"Không thể kích hoạt symbol {symbol}")
            return None

    return {
        'name': symbol_info.name,
        'bid': symbol_info.bid,
        'ask': symbol_info.ask,
        'spread': symbol_info.ask - symbol_info.bid,
        'point': symbol_info.point,
        'digits': symbol_info.digits,
        'volume_min': symbol_info.volume_min,
        'volume_max': symbol_info.volume_max,
        'volume_step': symbol_info.volume_step,
        'trade_mode': symbol_info.trade_mode,
        'trade_stops_level': symbol_info.trade_stops_level,
        'trade_freeze_level': symbol_info.trade_freeze_level
    }

# Sử dụng
eurusd_info = get_symbol_info("EURUSD")
if eurusd_info:
    print(f"EURUSD - Bid: {eurusd_info['bid']}, Ask: {eurusd_info['ask']}")
    print(f"Spread: {eurusd_info['spread']}")
Hàm Lấy Giá Tick
def get_tick(symbol):
    """
    Lấy tick giá mới nhất

    Args:
        symbol: Tên symbol

    Returns:
        dict: Dictionary chứa thông tin tick hoặc None nếu lỗi
    """
    tick = mt5.symbol_info_tick(symbol)

    if tick is None:
        print(f"Không thể lấy tick cho {symbol}, error code =", mt5.last_error())
        return None

    return {
        'time': datetime.fromtimestamp(tick.time),
        'bid': tick.bid,
        'ask': tick.ask,
        'last': tick.last,
        'volume': tick.volume,
        'time_msc': tick.time_msc,
        'flags': tick.flags,
        'time_digits': tick.time_digits
    }

# Sử dụng
tick = get_tick("EURUSD")
if tick:
    print(f"Time: {tick['time']}")
    print(f"Bid: {tick['bid']}, Ask: {tick['ask']}")
Hàm Lấy Nhiều Tick
def get_ticks(symbol, count=1000):
    """
    Lấy nhiều tick gần nhất

    Args:
        symbol: Tên symbol
        count: Số lượng tick cần lấy

    Returns:
        DataFrame: DataFrame chứa tick data hoặc None nếu lỗi
    """
    ticks = mt5.copy_ticks_from(symbol, datetime.now(), count, mt5.COPY_TICKS_ALL)

    if ticks is None:
        print(f"Không thể lấy ticks cho {symbol}, error code =", mt5.last_error())
        return None

    # Chuyển đổi sang DataFrame
    ticks_df = pd.DataFrame(ticks)
    ticks_df['time'] = pd.to_datetime(ticks_df['time'], unit='s')

    return ticks_df

# Sử dụng
ticks = get_ticks("EURUSD", count=100)
if ticks is not None:
    print(ticks.head())
Lấy Dữ Liệu Lịch Sử (OHLC)
Hàm Lấy Dữ Liệu Theo Khung Thời Gian
def get_rates(symbol, timeframe, count=1000, start_time=None, end_time=None):
    """
    Lấy dữ liệu OHLC theo khung thời gian

    Args:
        symbol: Tên symbol
        timeframe: Khung thời gian (mt5.TIMEFRAME_M1, M5, M15, H1, D1, etc.)
        count: Số lượng nến cần lấy (nếu không có start_time/end_time)
        start_time: Thời gian bắt đầu (datetime)
        end_time: Thời gian kết thúc (datetime)

    Returns:
        DataFrame: DataFrame chứa OHLC data hoặc None nếu lỗi
    """
    if start_time and end_time:
        # Lấy dữ liệu theo khoảng thời gian
        rates = mt5.copy_rates_range(symbol, timeframe, start_time, end_time)
    elif start_time:
        # Lấy dữ liệu từ start_time đến hiện tại
        rates = mt5.copy_rates_from(symbol, timeframe, start_time, count)
    else:
        # Lấy dữ liệu gần nhất
        rates = mt5.copy_rates_from_pos(symbol, timeframe, 0, count)

    if rates is None:
        print(f"Không thể lấy rates cho {symbol}, error code =", mt5.last_error())
        return None

    # Chuyển đổi sang DataFrame
    rates_df = pd.DataFrame(rates)
    rates_df['time'] = pd.to_datetime(rates_df['time'], unit='s')

    return rates_df

# Sử dụng
# Lấy 100 nến H1 gần nhất
eurusd_h1 = get_rates("EURUSD", mt5.TIMEFRAME_H1, count=100)
if eurusd_h1 is not None:
    print(eurusd_h1.head())
    print(f"\nTổng số nến: {len(eurusd_h1)}")

# Lấy dữ liệu theo khoảng thời gian
start = datetime(2024, 1, 1)
end = datetime(2024, 1, 31)
eurusd_range = get_rates("EURUSD", mt5.TIMEFRAME_D1, start_time=start, end_time=end)
Hàm Lấy Dữ Liệu Nhiều Symbol
def get_multiple_symbols_rates(symbols, timeframe, count=100):
    """
    Lấy dữ liệu cho nhiều symbol cùng lúc

    Args:
        symbols: List các symbol
        timeframe: Khung thời gian
        count: Số lượng nến

    Returns:
        dict: Dictionary với key là symbol, value là DataFrame
    """
    data = {}

    for symbol in symbols:
        rates = get_rates(symbol, timeframe, count=count)
        if rates is not None:
            data[symbol] = rates

    return data

# Sử dụng
symbols = ["EURUSD", "GBPUSD", "USDJPY", "AUDUSD"]
multi_data = get_multiple_symbols_rates(symbols, mt5.TIMEFRAME_H1, count=100)
for symbol, df in multi_data.items():
    print(f"{symbol}: {len(df)} nến")
Lấy Thông Tin Symbol
Hàm Lấy Tất Cả Symbol
def get_all_symbols(group="*"):
    """
    Lấy danh sách tất cả symbol

    Args:
        group: Filter theo group (ví dụ: "EUR*", "*USD", "*")

    Returns:
        list: List các symbol
    """
    symbols = mt5.symbols_get(group)

    if symbols is None:
        print("Không thể lấy danh sách symbol, error code =", mt5.last_error())
        return []

    return [symbol.name for symbol in symbols]

# Sử dụng
all_symbols = get_all_symbols()
print(f"Tổng số symbol: {len(all_symbols)}")

# Lấy chỉ các cặp EUR
eur_symbols = get_all_symbols("EUR*")
print(f"Các cặp EUR: {eur_symbols[:10]}")
Hàm Lấy Thông Tin Chi Tiết Symbol
def get_symbol_details(symbol):
    """
    Lấy thông tin chi tiết của symbol

    Args:
        symbol: Tên symbol

    Returns:
        dict: Dictionary chứa thông tin chi tiết
    """
    symbol_info = mt5.symbol_info(symbol)

    if symbol_info is None:
        return None

    return {
        'name': symbol_info.name,
        'description': symbol_info.description,
        'currency_base': symbol_info.currency_base,
        'currency_profit': symbol_info.currency_profit,
        'currency_margin': symbol_info.currency_margin,
        'bid': symbol_info.bid,
        'ask': symbol_info.ask,
        'spread': symbol_info.ask - symbol_info.bid,
        'point': symbol_info.point,
        'digits': symbol_info.digits,
        'volume_min': symbol_info.volume_min,
        'volume_max': symbol_info.volume_max,
        'volume_step': symbol_info.volume_step,
        'volume_limit': symbol_info.volume_limit,
        'trade_mode': symbol_info.trade_mode,
        'trade_stops_level': symbol_info.trade_stops_level,
        'trade_freeze_level': symbol_info.trade_freeze_level,
        'swap_mode': symbol_info.swap_mode,
        'swap_long': symbol_info.swap_long,
        'swap_short': symbol_info.swap_short,
        'margin_initial': symbol_info.margin_initial,
        'margin_maintenance': symbol_info.margin_maintenance
    }

# Sử dụng
details = get_symbol_details("EURUSD")
if details:
    print(f"Symbol: {details['name']}")
    print(f"Base Currency: {details['currency_base']}")
    print(f"Profit Currency: {details['currency_profit']}")
    print(f"Min Volume: {details['volume_min']}")
    print(f"Max Volume: {details['volume_max']}")
Tính Toán Chỉ Báo Kỹ Thuật
Hàm Tính Moving Average
def calculate_ma(rates_df, period=20, ma_type='SMA'):
    """
    Tính Moving Average

    Args:
        rates_df: DataFrame chứa OHLC data
        period: Chu kỳ
        ma_type: Loại MA ('SMA', 'EMA', 'WMA')

    Returns:
        Series: Series chứa giá trị MA
    """
    if ma_type == 'SMA':
        return rates_df['close'].rolling(window=period).mean()
    elif ma_type == 'EMA':
        return rates_df['close'].ewm(span=period, adjust=False).mean()
    elif ma_type == 'WMA':
        weights = np.arange(1, period + 1)
        return rates_df['close'].rolling(window=period).apply(
            lambda x: np.dot(x, weights) / weights.sum(), raw=True
        )
    else:
        return rates_df['close'].rolling(window=period).mean()

# Sử dụng
rates = get_rates("EURUSD", mt5.TIMEFRAME_H1, count=200)
if rates is not None:
    rates['MA20'] = calculate_ma(rates, period=20, ma_type='SMA')
    rates['EMA12'] = calculate_ma(rates, period=12, ma_type='EMA')
    print(rates[['time', 'close', 'MA20', 'EMA12']].tail())
Hàm Tính RSI
import numpy as np

def calculate_rsi(rates_df, period=14):
    """
    Tính RSI (Relative Strength Index)

    Args:
        rates_df: DataFrame chứa OHLC data
        period: Chu kỳ (mặc định 14)

    Returns:
        Series: Series chứa giá trị RSI
    """
    delta = rates_df['close'].diff()

    gain = (delta.where(delta > 0, 0)).rolling(window=period).mean()
    loss = (-delta.where(delta < 0, 0)).rolling(window=period).mean()

    rs = gain / loss
    rsi = 100 - (100 / (1 + rs))

    return rsi

# Sử dụng
rates = get_rates("EURUSD", mt5.TIMEFRAME_H1, count=200)
if rates is not None:
    rates['RSI'] = calculate_rsi(rates, period=14)
    print(rates[['time', 'close', 'RSI']].tail())
Lấy Dữ Liệu Real-Time
Hàm Monitor Giá Real-Time
import time

def monitor_price(symbol, interval=1):
    """
    Monitor giá real-time

    Args:
        symbol: Tên symbol
        interval: Khoảng thời gian giữa các lần cập nhật (giây)
    """
    print(f"Bắt đầu monitor {symbol}...")
    print("Nhấn Ctrl+C để dừng\n")

    try:
        while True:
            tick = get_tick(symbol)
            if tick:
                print(f"[{tick['time']}] {symbol} - "
                      f"Bid: {tick['bid']:.5f} | "
                      f"Ask: {tick['ask']:.5f} | "
                      f"Spread: {tick['ask'] - tick['bid']:.5f}")

            time.sleep(interval)

    except KeyboardInterrupt:
        print("\nDừng monitor...")

# Sử dụng
# monitor_price("EURUSD", interval=1)
Hàm Lấy Giá Nhiều Symbol
def get_multiple_prices(symbols):
    """
    Lấy giá của nhiều symbol cùng lúc

    Args:
        symbols: List các symbol

    Returns:
        dict: Dictionary với key là symbol, value là dict chứa bid/ask
    """
    prices = {}

    for symbol in symbols:
        tick = get_tick(symbol)
        if tick:
            prices[symbol] = {
                'bid': tick['bid'],
                'ask': tick['ask'],
                'spread': tick['ask'] - tick['bid'],
                'time': tick['time']
            }

    return prices

# Sử dụng
symbols = ["EURUSD", "GBPUSD", "USDJPY", "AUDUSD"]
prices = get_multiple_prices(symbols)
for symbol, price_info in prices.items():
    print(f"{symbol}: Bid={price_info['bid']:.5f}, Ask={price_info['ask']:.5f}")
Lưu Dữ Liệu
Hàm Lưu Dữ Liệu Vào CSV
def save_to_csv(rates_df, filename):
    """
    Lưu dữ liệu vào file CSV

    Args:
        rates_df: DataFrame cần lưu
        filename: Tên file
    """
    rates_df.to_csv(filename, index=False)
    print(f"Đã lưu dữ liệu vào {filename}")

# Sử dụng
rates = get_rates("EURUSD", mt5.TIMEFRAME_H1, count=1000)
if rates is not None:
    save_to_csv(rates, "EURUSD_H1.csv")
Hàm Lưu Dữ Liệu Vào Database
import sqlite3

def save_to_database(rates_df, symbol, timeframe, db_name="mt5_data.db"):
    """
    Lưu dữ liệu vào SQLite database

    Args:
        rates_df: DataFrame cần lưu
        symbol: Tên symbol
        timeframe: Khung thời gian
        db_name: Tên database
    """
    conn = sqlite3.connect(db_name)

    table_name = f"{symbol}_{timeframe}".replace(" ", "_")
    rates_df.to_sql(table_name, conn, if_exists='replace', index=False)

    conn.close()
    print(f"Đã lưu dữ liệu vào database: {table_name}")

# Sử dụng
rates = get_rates("EURUSD", mt5.TIMEFRAME_H1, count=1000)
if rates is not None:
    save_to_database(rates, "EURUSD", "H1")
Class Quản Lý Dữ Liệu Thị Trường
class MT5MarketData:
    """Class quản lý dữ liệu thị trường MT5"""

    def __init__(self):
        """Khởi tạo và kết nối với MT5"""
        if not mt5.initialize():
            raise Exception(f"Không thể khởi tạo MT5, error code = {mt5.last_error()}")
        self.connected = True

    def __del__(self):
        """Đóng kết nối khi object bị hủy"""
        if self.connected:
            mt5.shutdown()

    def get_current_price(self, symbol):
        """Lấy giá hiện tại"""
        tick = get_tick(symbol)
        if tick:
            return {'bid': tick['bid'], 'ask': tick['ask']}
        return None

    def get_historical_data(self, symbol, timeframe, count=1000):
        """Lấy dữ liệu lịch sử"""
        return get_rates(symbol, timeframe, count=count)

    def get_ticks_data(self, symbol, count=1000):
        """Lấy tick data"""
        return get_ticks(symbol, count=count)

    def get_symbol_info(self, symbol):
        """Lấy thông tin symbol"""
        return get_symbol_info(symbol)

    def monitor_symbols(self, symbols, callback, interval=1):
        """
        Monitor nhiều symbol

        Args:
            symbols: List các symbol
            callback: Hàm callback được gọi mỗi khi có dữ liệu mới
            interval: Khoảng thời gian (giây)
        """
        import time
        try:
            while True:
                for symbol in symbols:
                    tick = get_tick(symbol)
                    if tick:
                        callback(symbol, tick)
                time.sleep(interval)
        except KeyboardInterrupt:
            print("Dừng monitor...")

# Sử dụng
def price_callback(symbol, tick):
    """Callback function"""
    print(f"{symbol}: Bid={tick['bid']:.5f}, Ask={tick['ask']:.5f}")

# market_data = MT5MarketData()
# market_data.monitor_symbols(["EURUSD", "GBPUSD"], price_callback, interval=1)
Ví Dụ Sử Dụng Thực Tế
Script Thu Thập Dữ Liệu
from datetime import datetime, timedelta

def collect_daily_data(symbols, days=30):
    """
    Thu thập dữ liệu hàng ngày cho nhiều symbol

    Args:
        symbols: List các symbol
        days: Số ngày cần thu thập
    """
    end_time = datetime.now()
    start_time = end_time - timedelta(days=days)

    for symbol in symbols:
        print(f"Đang thu thập dữ liệu cho {symbol}...")
        rates = get_rates(symbol, mt5.TIMEFRAME_D1,
                         start_time=start_time, end_time=end_time)

        if rates is not None:
            filename = f"{symbol}_D1_{days}days.csv"
            save_to_csv(rates, filename)
            print(f"Đã lưu {len(rates)} nến cho {symbol}")
        else:
            print(f"Không thể lấy dữ liệu cho {symbol}")

# Sử dụng
symbols = ["EURUSD", "GBPUSD", "USDJPY", "AUDUSD", "USDCAD"]
collect_daily_data(symbols, days=90)
Script Phân Tích Xu Hướng
def analyze_trend(symbol, timeframe, ma_period=20):
    """
    Phân tích xu hướng dựa trên Moving Average

    Args:
        symbol: Tên symbol
        timeframe: Khung thời gian
        ma_period: Chu kỳ MA
    """
    rates = get_rates(symbol, timeframe, count=200)

    if rates is None:
        return None

    # Tính MA
    rates['MA'] = calculate_ma(rates, period=ma_period)

    # Xác định xu hướng
    current_price = rates['close'].iloc[-1]
    current_ma = rates['MA'].iloc[-1]
    prev_price = rates['close'].iloc[-2]
    prev_ma = rates['MA'].iloc[-2]

    if current_price > current_ma and prev_price <= prev_ma:
        trend = "UPTREND (Giá vượt lên MA)"
    elif current_price < current_ma and prev_price >= prev_ma:
        trend = "DOWNTREND (Giá xuống dưới MA)"
    elif current_price > current_ma:
        trend = "UPTREND"
    else:
        trend = "DOWNTREND"

    return {
        'symbol': symbol,
        'current_price': current_price,
        'ma': current_ma,
        'trend': trend,
        'distance_from_ma': ((current_price - current_ma) / current_ma) * 100
    }

# Sử dụng
analysis = analyze_trend("EURUSD", mt5.TIMEFRAME_H1, ma_period=20)
if analysis:
    print(f"Symbol: {analysis['symbol']}")
    print(f"Giá hiện tại: {analysis['current_price']:.5f}")
    print(f"MA20: {analysis['ma']:.5f}")
    print(f"Xu hướng: {analysis['trend']}")
    print(f"Khoảng cách từ MA: {analysis['distance_from_ma']:.2f}%")
Kết Luận
Bài viết đã hướng dẫn cách viết các hàm để lấy dữ liệu thị trường Forex MT5 bằng Python. Các hàm này giúp bạn:
- Lấy giá real-time (bid/ask)
- Lấy dữ liệu lịch sử (OHLC)
- Lấy tick data
- Lấy thông tin symbol
- Tính toán chỉ báo kỹ thuật
- Monitor giá real-time
- Lưu dữ liệu vào file hoặc database
Lưu ý quan trọng:
- Luôn kiểm tra kết quả trả về từ các hàm MT5
- Xử lý lỗi đúng cách
- Sử dụng pandas để xử lý dữ liệu hiệu quả
- Lưu dữ liệu định kỳ để phân tích sau
Tài Liệu Tham Khảo
- MetaTrader5 Python Documentation
- MT5 Market Data Functions
- Cách Viết Hàm Để Lấy Thông Tin Tài Khoản MT5 Bằng Python
- Xây Dựng Bot Auto Trading Cho Forex MT5
Bài viết được biên soạn bởi CoinGetMarket – Nền tảng giáo dục về crypto và trading bot.
Bài viết gần đây
-
Bot Auto Trading là gì? Hướng dẫn xây dựng bot thực chiến 2026
Tháng 8 2, 2026 -
Nhật ký vận hành Bot MT5: mẫu 7 ngày & khi nào phải dừng bot
Tháng 8 1, 2026 -
Cài MT5 trên VPS từ A→Z & giữ Terminal sống sau khi đóng RDP
Tháng 8 1, 2026
| Cách Viết Hàm Để Lấy Thông Tin Tài Khoản MT5 Bằng Python
Được viết bởi thanhdt vào ngày 15/11/2025 lúc 21:33 | 261 lượt xem
Hướng dẫn chi tiết cách viết hàm để lấy thông tin tài khoản MetaTrader 5 bằng Python sử dụng thư viện MetaTrader5.
Cách Viết Hàm Để Lấy Thông Tin Tài Khoản MT5 Bằng Python
Python có thể kết nối với MetaTrader 5 thông qua thư viện MetaTrader5 để lấy thông tin tài khoản, quản lý lệnh và tự động hóa giao dịch. Bài viết này sẽ hướng dẫn bạn cách viết các hàm để lấy thông tin tài khoản MT5 bằng Python.
Cài Đặt Thư Viện
Trước tiên, cần cài đặt thư viện MetaTrader5:
pip install MetaTrader5Kết Nối Với MT5
Hàm Kết Nối Cơ Bản
import MetaTrader5 as mt5

def connect_mt5(login=None, password=None, server=None, path=None):
    """
    Kết nối với MetaTrader 5

    Args:
        login: Số tài khoản (None nếu dùng tài khoản đã đăng nhập)
        password: Mật khẩu (None nếu dùng tài khoản đã đăng nhập)
        server: Tên server (None nếu dùng server mặc định)
        path: Đường dẫn đến MT5 (None nếu dùng đường dẫn mặc định)

    Returns:
        bool: True nếu kết nối thành công, False nếu thất bại
    """
    # Khởi tạo MT5
    if not mt5.initialize(path=path):
        print("Khởi tạo MT5 thất bại, error code =", mt5.last_error())
        return False

    # Đăng nhập nếu có thông tin
    if login and password and server:
        authorized = mt5.login(login, password=password, server=server)
        if not authorized:
            print("Đăng nhập thất bại, error code =", mt5.last_error())
            mt5.shutdown()
            return False
        print(f"Đăng nhập thành công vào tài khoản {login}")
    else:
        # Sử dụng tài khoản đã đăng nhập trong MT5
        account_info = mt5.account_info()
        if account_info is None:
            print("Không thể lấy thông tin tài khoản, error code =", mt5.last_error())
            mt5.shutdown()
            return False
        print(f"Đã kết nối với tài khoản {account_info.login}")

    return True

# Sử dụng
if connect_mt5():
    print("Kết nối MT5 thành công!")
else:
    print("Kết nối MT5 thất bại!")
Hàm Ngắt Kết Nối
def disconnect_mt5():
    """Ngắt kết nối với MT5"""
    mt5.shutdown()
    print("Đã ngắt kết nối MT5")
Lấy Thông Tin Tài Khoản
Hàm Lấy Tất Cả Thông Tin Tài Khoản
def get_account_info():
    """
    Lấy tất cả thông tin tài khoản

    Returns:
        dict: Dictionary chứa thông tin tài khoản hoặc None nếu lỗi
    """
    account_info = mt5.account_info()

    if account_info is None:
        print("Không thể lấy thông tin tài khoản, error code =", mt5.last_error())
        return None

    # Chuyển đổi sang dictionary
    account_dict = {
        'login': account_info.login,
        'trade_mode': account_info.trade_mode,
        'leverage': account_info.leverage,
        'limit_orders': account_info.limit_orders,
        'margin_so_mode': account_info.margin_so_mode,
        'trade_allowed': account_info.trade_allowed,
        'trade_expert': account_info.trade_expert,
        'margin_mode': account_info.margin_mode,
        'currency_digits': account_info.currency_digits,
        'fifo_close': account_info.fifo_close,
        'balance': account_info.balance,
        'credit': account_info.credit,
        'profit': account_info.profit,
        'equity': account_info.equity,
        'margin': account_info.margin,
        'margin_free': account_info.margin_free,
        'margin_level': account_info.margin_level,
        'margin_so_call': account_info.margin_so_call,
        'margin_so_so': account_info.margin_so_so,
        'margin_initial': account_info.margin_initial,
        'margin_maintenance': account_info.margin_maintenance,
        'assets': account_info.assets,
        'liabilities': account_info.liabilities,
        'commission_blocked': account_info.commission_blocked,
        'name': account_info.name,
        'server': account_info.server,
        'currency': account_info.currency,
        'company': account_info.company
    }

    return account_dict
Hàm Lấy Số Dư (Balance)
def get_balance():
    """
    Lấy số dư tài khoản

    Returns:
        float: Số dư tài khoản hoặc None nếu lỗi
    """
    account_info = mt5.account_info()

    if account_info is None:
        print("Không thể lấy thông tin tài khoản, error code =", mt5.last_error())
        return None

    return account_info.balance
Hàm Lấy Equity
def get_equity():
    """
    Lấy equity (tài sản ròng) của tài khoản

    Equity = Balance + Credit + Profit

    Returns:
        float: Equity hoặc None nếu lỗi
    """
    account_info = mt5.account_info()

    if account_info is None:
        print("Không thể lấy thông tin tài khoản, error code =", mt5.last_error())
        return None

    return account_info.equity
Hàm Lấy Margin
def get_margin():
    """
    Lấy margin đã sử dụng

    Returns:
        float: Margin đã sử dụng hoặc None nếu lỗi
    """
    account_info = mt5.account_info()

    if account_info is None:
        print("Không thể lấy thông tin tài khoản, error code =", mt5.last_error())
        return None

    return account_info.margin
Hàm Lấy Margin Free
def get_margin_free():
    """
    Lấy margin còn lại (có thể sử dụng)

    Margin Free = Equity - Margin

    Returns:
        float: Margin free hoặc None nếu lỗi
    """
    account_info = mt5.account_info()

    if account_info is None:
        print("Không thể lấy thông tin tài khoản, error code =", mt5.last_error())
        return None

    return account_info.margin_free
Hàm Lấy Margin Level
def get_margin_level():
    """
    Lấy margin level (tỷ lệ margin)

    Margin Level = (Equity / Margin) * 100

    Returns:
        float: Margin level (%) hoặc None nếu lỗi
    """
    account_info = mt5.account_info()

    if account_info is None:
        print("Không thể lấy thông tin tài khoản, error code =", mt5.last_error())
        return None

    return account_info.margin_level
Hàm Lấy Profit
def get_profit():
    """
    Lấy lợi nhuận/thua lỗ hiện tại của tất cả các lệnh mở

    Returns:
        float: Profit (dương = lợi nhuận, âm = thua lỗ) hoặc None nếu lỗi
    """
    account_info = mt5.account_info()

    if account_info is None:
        print("Không thể lấy thông tin tài khoản, error code =", mt5.last_error())
        return None

    return account_info.profit
Hàm Tổng Hợp
Hàm Hiển Thị Tất Cả Thông Tin
def display_account_info():
    """Hiển thị tất cả thông tin tài khoản"""
    account_info = mt5.account_info()

    if account_info is None:
        print("Không thể lấy thông tin tài khoản, error code =", mt5.last_error())
        return

    print("=" * 50)
    print("THÔNG TIN TÀI KHOẢN MT5")
    print("=" * 50)
    print(f"Login: {account_info.login}")
    print(f"Tên: {account_info.name}")
    print(f"Server: {account_info.server}")
    print(f"Company: {account_info.company}")
    print(f"Currency: {account_info.currency}")
    print(f"Leverage: 1:{account_info.leverage}")
    print("-" * 50)
    print("SỐ DƯ VÀ TÀI SẢN")
    print("-" * 50)
    print(f"Balance: {account_info.balance:.2f} {account_info.currency}")
    print(f"Credit: {account_info.credit:.2f} {account_info.currency}")
    print(f"Profit: {account_info.profit:.2f} {account_info.currency}")
    print(f"Equity: {account_info.equity:.2f} {account_info.currency}")
    print("-" * 50)
    print("MARGIN")
    print("-" * 50)
    print(f"Margin: {account_info.margin:.2f} {account_info.currency}")
    print(f"Margin Free: {account_info.margin_free:.2f} {account_info.currency}")
    print(f"Margin Level: {account_info.margin_level:.2f}%")
    print(f"Margin Initial: {account_info.margin_initial:.2f} {account_info.currency}")
    print(f"Margin Maintenance: {account_info.margin_maintenance:.2f} {account_info.currency}")
    print("-" * 50)
    print("TRẠNG THÁI")
    print("-" * 50)
    print(f"Trade Allowed: {account_info.trade_allowed}")
    print(f"Trade Expert: {account_info.trade_expert}")
    print(f"Trade Mode: {account_info.trade_mode}")
    print(f"Margin Mode: {account_info.margin_mode}")
    print("=" * 50)

# Sử dụng
if connect_mt5():
    display_account_info()
    disconnect_mt5()
Hàm Kiểm Tra Điều Kiện Giao Dịch
def can_trade():
    """
    Kiểm tra xem có thể giao dịch không

    Returns:
        dict: Dictionary chứa các điều kiện giao dịch
    """
    account_info = mt5.account_info()

    if account_info is None:
        return {
            'can_trade': False,
            'reason': 'Không thể lấy thông tin tài khoản'
        }

    conditions = {
        'can_trade': True,
        'trade_allowed': account_info.trade_allowed,
        'trade_expert': account_info.trade_expert,
        'margin_free': account_info.margin_free,
        'margin_level': account_info.margin_level,
        'reasons': []
    }

    # Kiểm tra các điều kiện
    if not account_info.trade_allowed:
        conditions['can_trade'] = False
        conditions['reasons'].append('Giao dịch không được phép')

    if not account_info.trade_expert:
        conditions['can_trade'] = False
        conditions['reasons'].append('Expert Advisor không được phép')

    if account_info.margin_free <= 0:
        conditions['can_trade'] = False
        conditions['reasons'].append('Không còn margin free')

    if account_info.margin_level < 100:
        conditions['can_trade'] = False
        conditions['reasons'].append(f'Margin level thấp: {account_info.margin_level:.2f}%')

    return conditions

# Sử dụng
if connect_mt5():
    conditions = can_trade()
    if conditions['can_trade']:
        print("Có thể giao dịch")
    else:
        print("Không thể giao dịch:")
        for reason in conditions['reasons']:
            print(f"  - {reason}")
    disconnect_mt5()
Lấy Thông Tin Chi Tiết
Hàm Lấy Thông Tin Theo Từng Trường
def get_account_field(field_name):
    """
    Lấy thông tin tài khoản theo tên trường

    Args:
        field_name: Tên trường cần lấy (balance, equity, margin, etc.)

    Returns:
        Giá trị của trường hoặc None nếu lỗi
    """
    account_info = mt5.account_info()

    if account_info is None:
        print("Không thể lấy thông tin tài khoản, error code =", mt5.last_error())
        return None

    # Dictionary mapping tên trường
    field_mapping = {
        'login': account_info.login,
        'balance': account_info.balance,
        'equity': account_info.equity,
        'margin': account_info.margin,
        'margin_free': account_info.margin_free,
        'margin_level': account_info.margin_level,
        'profit': account_info.profit,
        'credit': account_info.credit,
        'leverage': account_info.leverage,
        'currency': account_info.currency,
        'server': account_info.server,
        'name': account_info.name,
        'company': account_info.company
    }

    return field_mapping.get(field_name.lower(), None)

# Sử dụng
if connect_mt5():
    balance = get_account_field('balance')
    equity = get_account_field('equity')
    margin = get_account_field('margin')

    print(f"Balance: {balance}")
    print(f"Equity: {equity}")
    print(f"Margin: {margin}")

    disconnect_mt5()
Class Quản Lý Tài Khoản
Class MT5Account
import MetaTrader5 as mt5
from typing import Optional, Dict

class MT5Account:
    """Class quản lý tài khoản MT5"""

    def __init__(self, login=None, password=None, server=None, path=None):
        """
        Khởi tạo và kết nối với MT5

        Args:
            login: Số tài khoản
            password: Mật khẩu
            server: Tên server
            path: Đường dẫn đến MT5
        """
        self.login = login
        self.password = password
        self.server = server
        self.path = path
        self.connected = False

        if self.connect():
            self.connected = True

    def connect(self) -> bool:
        """Kết nối với MT5"""
        if not mt5.initialize(path=self.path):
            print("Khởi tạo MT5 thất bại, error code =", mt5.last_error())
            return False

        if self.login and self.password and self.server:
            authorized = mt5.login(self.login, password=self.password, server=self.server)
            if not authorized:
                print("Đăng nhập thất bại, error code =", mt5.last_error())
                mt5.shutdown()
                return False

        return True

    def disconnect(self):
        """Ngắt kết nối với MT5"""
        mt5.shutdown()
        self.connected = False

    def get_info(self) -> Optional[Dict]:
        """Lấy tất cả thông tin tài khoản"""
        if not self.connected:
            print("Chưa kết nối với MT5")
            return None

        account_info = mt5.account_info()
        if account_info is None:
            print("Không thể lấy thông tin tài khoản, error code =", mt5.last_error())
            return None

        return {
            'login': account_info.login,
            'balance': account_info.balance,
            'equity': account_info.equity,
            'margin': account_info.margin,
            'margin_free': account_info.margin_free,
            'margin_level': account_info.margin_level,
            'profit': account_info.profit,
            'credit': account_info.credit,
            'leverage': account_info.leverage,
            'currency': account_info.currency,
            'server': account_info.server,
            'name': account_info.name,
            'company': account_info.company,
            'trade_allowed': account_info.trade_allowed,
            'trade_expert': account_info.trade_expert
        }

    def get_balance(self) -> Optional[float]:
        """Lấy số dư tài khoản"""
        info = self.get_info()
        return info['balance'] if info else None

    def get_equity(self) -> Optional[float]:
        """Lấy equity"""
        info = self.get_info()
        return info['equity'] if info else None

    def get_margin(self) -> Optional[float]:
        """Lấy margin đã sử dụng"""
        info = self.get_info()
        return info['margin'] if info else None

    def get_margin_free(self) -> Optional[float]:
        """Lấy margin free"""
        info = self.get_info()
        return info['margin_free'] if info else None

    def get_margin_level(self) -> Optional[float]:
        """Lấy margin level"""
        info = self.get_info()
        return info['margin_level'] if info else None

    def get_profit(self) -> Optional[float]:
        """Lấy profit"""
        info = self.get_info()
        return info['profit'] if info else None

    def can_trade(self) -> bool:
        """Kiểm tra có thể giao dịch không"""
        info = self.get_info()
        if not info:
            return False

        return (info['trade_allowed'] and
                info['trade_expert'] and
                info['margin_free'] > 0 and
                info['margin_level'] >= 100)

    def display_info(self):
        """Hiển thị thông tin tài khoản"""
        info = self.get_info()
        if not info:
            return

        print("=" * 50)
        print("THÔNG TIN TÀI KHOẢN MT5")
        print("=" * 50)
        print(f"Login: {info['login']}")
        print(f"Tên: {info['name']}")
        print(f"Server: {info['server']}")
        print(f"Company: {info['company']}")
        print(f"Currency: {info['currency']}")
        print(f"Leverage: 1:{info['leverage']}")
        print("-" * 50)
        print(f"Balance: {info['balance']:.2f} {info['currency']}")
        print(f"Equity: {info['equity']:.2f} {info['currency']}")
        print(f"Margin: {info['margin']:.2f} {info['currency']}")
        print(f"Margin Free: {info['margin_free']:.2f} {info['currency']}")
        print(f"Margin Level: {info['margin_level']:.2f}%")
        print(f"Profit: {info['profit']:.2f} {info['currency']}")
        print("-" * 50)
        print(f"Trade Allowed: {info['trade_allowed']}")
        print(f"Trade Expert: {info['trade_expert']}")
        print(f"Can Trade: {self.can_trade()}")
        print("=" * 50)

    def __enter__(self):
        """Context manager entry"""
        return self

    def __exit__(self, exc_type, exc_val, exc_tb):
        """Context manager exit"""
        self.disconnect()

# Sử dụng class
if __name__ == "__main__":
    # Sử dụng với context manager
    with MT5Account() as account:
        account.display_info()
        print(f"\nBalance: {account.get_balance()}")
        print(f"Equity: {account.get_equity()}")
        print(f"Can Trade: {account.can_trade()}")
Ví Dụ Sử Dụng Thực Tế
Script Kiểm Tra Tài Khoản
import MetaTrader5 as mt5
from datetime import datetime

def check_account_status():
    """Kiểm tra trạng thái tài khoản"""
    if not mt5.initialize():
        print("Không thể khởi tạo MT5")
        return

    account_info = mt5.account_info()
    if account_info is None:
        print("Không thể lấy thông tin tài khoản")
        mt5.shutdown()
        return

    print(f"\n[{datetime.now().strftime('%Y-%m-%d %H:%M:%S')}]")
    print(f"Tài khoản: {account_info.login}")
    print(f"Balance: {account_info.balance:.2f} {account_info.currency}")
    print(f"Equity: {account_info.equity:.2f} {account_info.currency}")
    print(f"Margin Level: {account_info.margin_level:.2f}%")
    print(f"Profit: {account_info.profit:.2f} {account_info.currency}")

    # Cảnh báo nếu margin level thấp
    if account_info.margin_level < 200:
        print("⚠️ CẢNH BÁO: Margin level thấp!")

    mt5.shutdown()

# Chạy kiểm tra
check_account_status()
Script Monitor Tài Khoản
import MetaTrader5 as mt5
import time
from datetime import datetime

def monitor_account(interval=60):
    """
    Monitor tài khoản liên tục

    Args:
        interval: Khoảng thời gian giữa các lần kiểm tra (giây)
    """
    if not mt5.initialize():
        print("Không thể khởi tạo MT5")
        return

    print("Bắt đầu monitor tài khoản...")
    print("Nhấn Ctrl+C để dừng\n")

    try:
        while True:
            account_info = mt5.account_info()
            if account_info:
                print(f"[{datetime.now().strftime('%Y-%m-%d %H:%M:%S')}] "
                      f"Balance: {account_info.balance:.2f} | "
                      f"Equity: {account_info.equity:.2f} | "
                      f"Margin Level: {account_info.margin_level:.2f}% | "
                      f"Profit: {account_info.profit:.2f}")

            time.sleep(interval)

    except KeyboardInterrupt:
        print("\nDừng monitor...")
    finally:
        mt5.shutdown()

# Chạy monitor (kiểm tra mỗi 60 giây)
# monitor_account(60)
Kết Luận
Bài viết đã hướng dẫn cách viết các hàm để lấy thông tin tài khoản MT5 bằng Python. Các hàm này giúp bạn:
- Kết nối và quản lý kết nối với MT5
- Lấy các thông tin cơ bản: balance, equity, margin
- Kiểm tra điều kiện giao dịch
- Monitor tài khoản liên tục
- Sử dụng class để quản lý code tốt hơn
Lưu ý quan trọng:
- Luôn kiểm tra kết quả trả về từ các hàm MT5
- Xử lý lỗi đúng cách
- Đóng kết nối khi không sử dụng
- Sử dụng context manager để đảm bảo đóng kết nối
Tài Liệu Tham Khảo
- MetaTrader5 Python Documentation
- MT5 Python API Reference
- Xây Dựng Bot Auto Trading Cho Forex MT5
- Python Kết Nối MT5
Bài viết được biên soạn bởi CoinGetMarket – Nền tảng giáo dục về crypto và trading bot.
Bài viết gần đây
-
Bot Auto Trading là gì? Hướng dẫn xây dựng bot thực chiến 2026
Tháng 8 2, 2026 -
Nhật ký vận hành Bot MT5: mẫu 7 ngày & khi nào phải dừng bot
Tháng 8 1, 2026 -
Cài MT5 trên VPS từ A→Z & giữ Terminal sống sau khi đóng RDP
Tháng 8 1, 2026
| Xây Dựng Bot Auto Trading Cho Forex MT5
Được viết bởi thanhdt vào ngày 15/11/2025 lúc 21:24 | 521 lượt xem

Hướng dẫn chi tiết cách xây dựng bot auto trading cho Forex trên MetaTrader 5 với MQL5, từ cơ bản đến nâng cao.
Xây Dựng Bot Auto Trading Cho Forex MT5
MetaTrader 5 (MT5) là một trong những nền tảng giao dịch phổ biến nhất cho Forex. Bài viết này sẽ hướng dẫn bạn cách xây dựng bot auto trading (Expert Advisor – EA) cho Forex trên MT5 sử dụng ngôn ngữ MQL5.
Tổng Quan Về Expert Advisor (EA)
Expert Advisor (EA) là chương trình tự động thực hiện giao dịch trên MetaTrader dựa trên các quy tắc đã được lập trình sẵn. EA có thể:
- Hoạt động 24/7 không cần giám sát
- Loại bỏ cảm xúc trong giao dịch
- Thực hiện chiến lược phức tạp
- Phản ứng nhanh với biến động thị trường
- Backtest để kiểm chứng chiến lược
Chuẩn Bị Môi Trường
Cài Đặt MetaTrader 5
- Tải MetaTrader 5 từ trang chủ của broker
- Cài đặt và đăng nhập tài khoản
- Mở MetaEditor (F4 trong MT5)
Hiểu Về MQL5
MQL5 (MetaQuotes Language 5) là ngôn ngữ lập trình để viết EA cho MT5. Cú pháp tương tự C++ nhưng đơn giản hơn.
Cấu Trúc Cơ Bản Của EA
Template EA Đơn Giản
//+------------------------------------------------------------------+
//|                                                  SimpleEA.mq5    |
//|                                  Copyright 2025, CoinGetMarket   |
//|                                             https://www.mql5.com |
//+------------------------------------------------------------------+
#property copyright "Copyright 2025, CoinGetMarket"
#property link      "https://www.mql5.com"
#property version   "1.00"

// Input parameters
input double   LotSize = 0.01;           // Lot size
input int      MagicNumber = 123456;    // Magic number
input int      StopLoss = 50;            // Stop Loss (points)
input int      TakeProfit = 100;         // Take Profit (points)

// Global variables
int handleMA;  // Handle for Moving Average indicator

//+------------------------------------------------------------------+
//| Expert initialization function                                   |
//+------------------------------------------------------------------+
int OnInit()
{
   // Create Moving Average indicator
   handleMA = iMA(_Symbol, PERIOD_CURRENT, 20, 0, MODE_SMA, PRICE_CLOSE);

   if(handleMA == INVALID_HANDLE)
   {
      Print("Error creating MA indicator");
      return(INIT_FAILED);
   }

   Print("EA initialized successfully");
   return(INIT_SUCCEEDED);
}

//+------------------------------------------------------------------+
//| Expert deinitialization function                                 |
//+------------------------------------------------------------------+
void OnDeinit(const int reason)
{
   // Release indicator handle
   if(handleMA != INVALID_HANDLE)
      IndicatorRelease(handleMA);
}

//+------------------------------------------------------------------+
//| Expert tick function                                             |
//+------------------------------------------------------------------+
void OnTick()
{
   // Check if we have enough bars
   if(Bars(_Symbol, PERIOD_CURRENT) < 20)
      return;

   // Get MA values
   double ma[];
   ArraySetAsSeries(ma, true);
   if(CopyBuffer(handleMA, 0, 0, 2, ma) < 2)
      return;

   // Get current price
   double ask = SymbolInfoDouble(_Symbol, SYMBOL_ASK);
   double bid = SymbolInfoDouble(_Symbol, SYMBOL_BID);

   // Check for buy signal
   if(ma[1] < ask && ma[0] > ask)
   {
      OpenBuyOrder();
   }

   // Check for sell signal
   if(ma[1] > bid && ma[0] < bid)
   {
      OpenSellOrder();
   }
}

//+------------------------------------------------------------------+
//| Open Buy Order                                                   |
//+------------------------------------------------------------------+
void OpenBuyOrder()
{
   // Check if we already have a position
   if(PositionSelect(_Symbol))
      return;

   MqlTradeRequest request = {};
   MqlTradeResult  result = {};

   request.action = TRADE_ACTION_DEAL;
   request.symbol = _Symbol;
   request.volume = LotSize;
   request.type = ORDER_TYPE_BUY;
   request.price = SymbolInfoDouble(_Symbol, SYMBOL_ASK);
   request.deviation = 10;
   request.magic = MagicNumber;
   request.comment = "EA Buy Order";
   request.type_filling = ORDER_FILLING_FOK;

   // Set Stop Loss and Take Profit
   if(StopLoss > 0)
      request.sl = request.price - StopLoss * _Point;
   if(TakeProfit > 0)
      request.tp = request.price + TakeProfit * _Point;

   // Send order
   if(!OrderSend(request, result))
   {
      Print("Error opening buy order: ", GetLastError());
      return;
   }

   if(result.retcode == TRADE_RETCODE_DONE)
      Print("Buy order opened successfully. Ticket: ", result.order);
}

//+------------------------------------------------------------------+
//| Open Sell Order                                                  |
//+------------------------------------------------------------------+
void OpenSellOrder()
{
   // Check if we already have a position
   if(PositionSelect(_Symbol))
      return;

   MqlTradeRequest request = {};
   MqlTradeResult  result = {};

   request.action = TRADE_ACTION_DEAL;
   request.symbol = _Symbol;
   request.volume = LotSize;
   request.type = ORDER_TYPE_SELL;
   request.price = SymbolInfoDouble(_Symbol, SYMBOL_BID);
   request.deviation = 10;
   request.magic = MagicNumber;
   request.comment = "EA Sell Order";
   request.type_filling = ORDER_FILLING_FOK;

   // Set Stop Loss and Take Profit
   if(StopLoss > 0)
      request.sl = request.price + StopLoss * _Point;
   if(TakeProfit > 0)
      request.tp = request.price - TakeProfit * _Point;

   // Send order
   if(!OrderSend(request, result))
   {
      Print("Error opening sell order: ", GetLastError());
      return;
   }

   if(result.retcode == TRADE_RETCODE_DONE)
      Print("Sell order opened successfully. Ticket: ", result.order);
}
Chiến Lược Giao Dịch
Chiến Lược 1: Moving Average Crossover
//+------------------------------------------------------------------+
//|                                                  MACrossover.mq5 |
//+------------------------------------------------------------------+
#property copyright "Copyright 2025, CoinGetMarket"
#property version   "1.00"

input double   LotSize = 0.01;
input int      MagicNumber = 123456;
input int      FastMA = 10;
input int      SlowMA = 20;
input int      StopLoss = 50;
input int      TakeProfit = 100;

int handleFastMA;
int handleSlowMA;

int OnInit()
{
   handleFastMA = iMA(_Symbol, PERIOD_CURRENT, FastMA, 0, MODE_EMA, PRICE_CLOSE);
   handleSlowMA = iMA(_Symbol, PERIOD_CURRENT, SlowMA, 0, MODE_EMA, PRICE_CLOSE);

   if(handleFastMA == INVALID_HANDLE || handleSlowMA == INVALID_HANDLE)
   {
      Print("Error creating MA indicators");
      return(INIT_FAILED);
   }

   return(INIT_SUCCEEDED);
}

void OnDeinit(const int reason)
{
   if(handleFastMA != INVALID_HANDLE)
      IndicatorRelease(handleFastMA);
   if(handleSlowMA != INVALID_HANDLE)
      IndicatorRelease(handleSlowMA);
}

void OnTick()
{
   if(Bars(_Symbol, PERIOD_CURRENT) < SlowMA)
      return;

   double fastMA[], slowMA[];
   ArraySetAsSeries(fastMA, true);
   ArraySetAsSeries(slowMA, true);

   if(CopyBuffer(handleFastMA, 0, 0, 2, fastMA) < 2)
      return;
   if(CopyBuffer(handleSlowMA, 0, 0, 2, slowMA) < 2)
      return;

   // Golden Cross: Fast MA crosses above Slow MA
   if(fastMA[1] <= slowMA[1] && fastMA[0] > slowMA[0])
   {
      CloseAllPositions();
      OpenBuyOrder();
   }

   // Death Cross: Fast MA crosses below Slow MA
   if(fastMA[1] >= slowMA[1] && fastMA[0] < slowMA[0])
   {
      CloseAllPositions();
      OpenSellOrder();
   }
}

void CloseAllPositions()
{
   for(int i = PositionsTotal() - 1; i >= 0; i--)
   {
      ulong ticket = PositionGetTicket(i);
      if(ticket > 0)
      {
         if(PositionGetString(POSITION_SYMBOL) == _Symbol &&
            PositionGetInteger(POSITION_MAGIC) == MagicNumber)
         {
            MqlTradeRequest request = {};
            MqlTradeResult  result = {};

            request.action = TRADE_ACTION_DEAL;
            request.position = ticket;
            request.symbol = _Symbol;
            request.volume = PositionGetDouble(POSITION_VOLUME);
            request.deviation = 10;
            request.magic = MagicNumber;

            if(PositionGetInteger(POSITION_TYPE) == POSITION_TYPE_BUY)
            {
               request.type = ORDER_TYPE_SELL;
               request.price = SymbolInfoDouble(_Symbol, SYMBOL_BID);
            }
            else
            {
               request.type = ORDER_TYPE_BUY;
               request.price = SymbolInfoDouble(_Symbol, SYMBOL_ASK);
            }

            request.type_filling = ORDER_FILLING_FOK;

            OrderSend(request, result);
         }
      }
   }
}

void OpenBuyOrder()
{
   if(PositionSelect(_Symbol))
      return;

   MqlTradeRequest request = {};
   MqlTradeResult  result = {};

   request.action = TRADE_ACTION_DEAL;
   request.symbol = _Symbol;
   request.volume = LotSize;
   request.type = ORDER_TYPE_BUY;
   request.price = SymbolInfoDouble(_Symbol, SYMBOL_ASK);
   request.deviation = 10;
   request.magic = MagicNumber;
   request.comment = "MA Crossover Buy";
   request.type_filling = ORDER_FILLING_FOK;

   if(StopLoss > 0)
      request.sl = request.price - StopLoss * _Point;
   if(TakeProfit > 0)
      request.tp = request.price + TakeProfit * _Point;

   OrderSend(request, result);
}

void OpenSellOrder()
{
   if(PositionSelect(_Symbol))
      return;

   MqlTradeRequest request = {};
   MqlTradeResult  result = {};

   request.action = TRADE_ACTION_DEAL;
   request.symbol = _Symbol;
   request.volume = LotSize;
   request.type = ORDER_TYPE_SELL;
   request.price = SymbolInfoDouble(_Symbol, SYMBOL_BID);
   request.deviation = 10;
   request.magic = MagicNumber;
   request.comment = "MA Crossover Sell";
   request.type_filling = ORDER_FILLING_FOK;

   if(StopLoss > 0)
      request.sl = request.price + StopLoss * _Point;
   if(TakeProfit > 0)
      request.tp = request.price - TakeProfit * _Point;

   OrderSend(request, result);
}
Chiến Lược 2: RSI Overbought/Oversold
//+------------------------------------------------------------------+
//|                                                      RSI_EA.mq5   |
//+------------------------------------------------------------------+
#property copyright "Copyright 2025, CoinGetMarket"
#property version   "1.00"

input double   LotSize = 0.01;
input int      MagicNumber = 123456;
input int      RSIPeriod = 14;
input double   Overbought = 70;
input double   Oversold = 30;
input int      StopLoss = 50;
input int      TakeProfit = 100;

int handleRSI;

int OnInit()
{
   handleRSI = iRSI(_Symbol, PERIOD_CURRENT, RSIPeriod, PRICE_CLOSE);

   if(handleRSI == INVALID_HANDLE)
   {
      Print("Error creating RSI indicator");
      return(INIT_FAILED);
   }

   return(INIT_SUCCEEDED);
}

void OnDeinit(const int reason)
{
   if(handleRSI != INVALID_HANDLE)
      IndicatorRelease(handleRSI);
}

void OnTick()
{
   if(Bars(_Symbol, PERIOD_CURRENT) < RSIPeriod)
      return;

   double rsi[];
   ArraySetAsSeries(rsi, true);

   if(CopyBuffer(handleRSI, 0, 0, 1, rsi) < 1)
      return;

   // Buy signal: RSI crosses above oversold level
   if(rsi[0] > Oversold && rsi[0] < 50)
   {
      if(!PositionSelect(_Symbol))
         OpenBuyOrder();
   }

   // Sell signal: RSI crosses below overbought level
   if(rsi[0] < Overbought && rsi[0] > 50)
   {
      if(!PositionSelect(_Symbol))
         OpenSellOrder();
   }
}

void OpenBuyOrder()
{
   MqlTradeRequest request = {};
   MqlTradeResult  result = {};

   request.action = TRADE_ACTION_DEAL;
   request.symbol = _Symbol;
   request.volume = LotSize;
   request.type = ORDER_TYPE_BUY;
   request.price = SymbolInfoDouble(_Symbol, SYMBOL_ASK);
   request.deviation = 10;
   request.magic = MagicNumber;
   request.comment = "RSI Buy";
   request.type_filling = ORDER_FILLING_FOK;

   if(StopLoss > 0)
      request.sl = request.price - StopLoss * _Point;
   if(TakeProfit > 0)
      request.tp = request.price + TakeProfit * _Point;

   OrderSend(request, result);
}

void OpenSellOrder()
{
   MqlTradeRequest request = {};
   MqlTradeResult  result = {};

   request.action = TRADE_ACTION_DEAL;
   request.symbol = _Symbol;
   request.volume = LotSize;
   request.type = ORDER_TYPE_SELL;
   request.price = SymbolInfoDouble(_Symbol, SYMBOL_BID);
   request.deviation = 10;
   request.magic = MagicNumber;
   request.comment = "RSI Sell";
   request.type_filling = ORDER_FILLING_FOK;

   if(StopLoss > 0)
      request.sl = request.price + StopLoss * _Point;
   if(TakeProfit > 0)
      request.tp = request.price - TakeProfit * _Point;

   OrderSend(request, result);
}
Quản Lý Rủi Ro
Trailing Stop
//+------------------------------------------------------------------+
//| Trailing Stop Function                                           |
//+------------------------------------------------------------------+
void TrailingStop(int trailingPoints)
{
   for(int i = PositionsTotal() - 1; i >= 0; i--)
   {
      ulong ticket = PositionGetTicket(i);
      if(ticket > 0)
      {
         if(PositionGetString(POSITION_SYMBOL) == _Symbol &&
            PositionGetInteger(POSITION_MAGIC) == MagicNumber)
         {
            double currentSL = PositionGetDouble(POSITION_SL);
            double currentTP = PositionGetDouble(POSITION_TP);
            double openPrice = PositionGetDouble(POSITION_PRICE_OPEN);

            if(PositionGetInteger(POSITION_TYPE) == POSITION_TYPE_BUY)
            {
               double newSL = SymbolInfoDouble(_Symbol, SYMBOL_BID) - trailingPoints * _Point;

               if(newSL > currentSL && newSL > openPrice)
               {
                  MqlTradeRequest request = {};
                  MqlTradeResult  result = {};

                  request.action = TRADE_ACTION_SLTP;
                  request.position = ticket;
                  request.symbol = _Symbol;
                  request.sl = newSL;
                  request.tp = currentTP;

                  OrderSend(request, result);
               }
            }
            else // SELL
            {
               double newSL = SymbolInfoDouble(_Symbol, SYMBOL_ASK) + trailingPoints * _Point;

               if((currentSL == 0 || newSL < currentSL) && newSL < openPrice)
               {
                  MqlTradeRequest request = {};
                  MqlTradeResult  result = {};

                  request.action = TRADE_ACTION_SLTP;
                  request.position = ticket;
                  request.symbol = _Symbol;
                  request.sl = newSL;
                  request.tp = currentTP;

                  OrderSend(request, result);
               }
            }
         }
      }
   }
}
Quản Lý Vốn
//+------------------------------------------------------------------+
//| Calculate Lot Size Based on Risk                                 |
//+------------------------------------------------------------------+
double CalculateLotSize(double riskPercent, int stopLossPoints)
{
   double accountBalance = AccountInfoDouble(ACCOUNT_BALANCE);
   double riskAmount = accountBalance * riskPercent / 100;

   double tickValue = SymbolInfoDouble(_Symbol, SYMBOL_TRADE_TICK_VALUE);
   double tickSize = SymbolInfoDouble(_Symbol, SYMBOL_TRADE_TICK_SIZE);
   double point = SymbolInfoDouble(_Symbol, SYMBOL_POINT);

   double lotSize = riskAmount / (stopLossPoints * point * tickValue / tickSize);

   // Normalize lot size
   double minLot = SymbolInfoDouble(_Symbol, SYMBOL_VOLUME_MIN);
   double maxLot = SymbolInfoDouble(_Symbol, SYMBOL_VOLUME_MAX);
   double lotStep = SymbolInfoDouble(_Symbol, SYMBOL_VOLUME_STEP);

   lotSize = MathFloor(lotSize / lotStep) * lotStep;

   if(lotSize < minLot)
      lotSize = minLot;
   if(lotSize > maxLot)
      lotSize = maxLot;

   return lotSize;
}
Xử Lý Lỗi và Logging
Hàm Logging
//+------------------------------------------------------------------+
//| Log Function                                                     |
//+------------------------------------------------------------------+
void LogTrade(string message)
{
   string filename = "EA_Log_" + TimeToString(TimeCurrent(), TIME_DATE) + ".txt";
   int fileHandle = FileOpen(filename, FILE_WRITE | FILE_READ | FILE_TXT);

   if(fileHandle != INVALID_HANDLE)
   {
      FileSeek(fileHandle, 0, SEEK_END);
      FileWrite(fileHandle, TimeToString(TimeCurrent()), message);
      FileClose(fileHandle);
   }
}

//+------------------------------------------------------------------+
//| Error Handling                                                   |
//+------------------------------------------------------------------+
string GetErrorDescription(int errorCode)
{
   string errorString;

   switch(errorCode)
   {
      case 10004: errorString = "Requote"; break;
      case 10006: errorString = "Request rejected"; break;
      case 10007: errorString = "Request canceled"; break;
      case 10008: errorString = "Order placed"; break;
      case 10009: errorString = "Request partially executed"; break;
      case 10010: errorString = "Request completed"; break;
      case 10011: errorString = "Request processing error"; break;
      case 10012: errorString = "Request canceled by trader"; break;
      case 10013: errorString = "Request placed, order awaiting execution"; break;
      case 10014: errorString = "Request placed, order partially executed"; break;
      case 10015: errorString = "Request processing error"; break;
      case 10016: errorString = "Request canceled automatically by server"; break;
      case 10017: errorString = "Request partially filled"; break;
      case 10018: errorString = "Request processing error"; break;
      case 10019: errorString = "Request rejected"; break;
      case 10020: errorString = "Request canceled"; break;
      case 10021: errorString = "Request processing error"; break;
      default: errorString = "Unknown error: " + IntegerToString(errorCode);
   }

   return errorString;
}
Backtesting
Cách Backtest EA
- Mở Strategy Tester trong MT5 (View -> Strategy Tester hoặc Ctrl+R)
- Chọn EA từ danh sách
- Chọn symbol và timeframe
- Chọn khoảng thời gian backtest
- Chọn chế độ: Every tick (chính xác nhất)
- Nhấn Start để bắt đầu backtest
Đánh Giá Kết Quả
Sau khi backtest, bạn sẽ thấy các chỉ số:
- Total Net Profit: Tổng lợi nhuận ròng
- Profit Factor: Tỷ lệ lợi nhuận/thua lỗ
- Expected Payoff: Lợi nhuận kỳ vọng
- Drawdown: Mức sụt giảm tối đa
- Win Rate: Tỷ lệ lệnh thắng
- Sharpe Ratio: Tỷ lệ lợi nhuận/rủi ro
Tối Ưu Hóa EA
Sử Dùng Genetic Algorithm
- Trong Strategy Tester, chọn tab “Inputs”
- Đánh dấu các tham số muốn tối ưu
- Đặt phạm vi giá trị cho mỗi tham số
- Chọn “Genetic Algorithm” trong Optimization
- Nhấn Start để bắt đầu tối ưu
Ví Dụ Tối Ưu Hóa
input int      FastMA = 10;        // Fast MA (5-20)
input int      SlowMA = 20;        // Slow MA (15-50)
input int      StopLoss = 50;      // Stop Loss (20-100)
input int      TakeProfit = 100;   // Take Profit (50-200)
Best Practices
1. Sử Dụng Magic Number
Luôn sử dụng Magic Number để phân biệt lệnh của EA với lệnh thủ công:
input int MagicNumber = 123456;2. Kiểm Tra Số Dư
Luôn kiểm tra số dư trước khi mở lệnh:
double balance = AccountInfoDouble(ACCOUNT_BALANCE);
double freeMargin = AccountInfoDouble(ACCOUNT_MARGIN_FREE);

if(freeMargin < requiredMargin)
{
   Print("Not enough margin");
   return;
}
3. Xử Lý Lỗi
Luôn kiểm tra kết quả của OrderSend:
if(!OrderSend(request, result))
{
   Print("OrderSend error: ", GetErrorDescription(result.retcode));
   return;
}
4. Tránh Giao Dịch Quá Nhiều
Sử dụng biến để theo dõi thời gian giao dịch cuối:
datetime lastTradeTime = 0;
int minMinutesBetweenTrades = 60;

void OnTick()
{
   if(TimeCurrent() - lastTradeTime < minMinutesBetweenTrades * 60)
      return;

   // Trading logic here
   lastTradeTime = TimeCurrent();
}
Kết Luận
Xây dựng bot auto trading cho Forex MT5 là một quá trình học hỏi liên tục. Bắt đầu với các chiến lược đơn giản, backtest kỹ lưỡng, và luôn quản lý rủi ro cẩn thận.
Lưu ý quan trọng:
- Giao dịch Forex có rủi ro cao, chỉ đầu tư số tiền bạn có thể chấp nhận mất
- Luôn backtest EA trước khi chạy trên tài khoản thật
- Bắt đầu với tài khoản demo để test EA
- Monitor EA thường xuyên khi chạy trên tài khoản thật
- Học hỏi và cải thiện EA liên tục
Tài Liệu Tham Khảo
- MQL5 Documentation
- MetaTrader 5 User Guide
- MQL5 Reference
- Kiến Thức Giao Dịch Tài Chính Crypto MQL MT5
Bài viết được biên soạn bởi Đặng Trí Thanh link zalo.me/0934145100 – Nền tảng giáo dục về crypto và trading bot.