Danh mục: Tin tức
Bài viết gần đây
-
Gia Công Bot Auto Trading | Case PyBot PyNhiQuaiBot 2026
Tháng 7 29, 2026 -
Bot Auto Trading XAUUSD MT5 | PyBot PyNhiQuaiBot Hedging Grid
Tháng 7 29, 2026
| XÂY DỰNG BOT AUTO TRADING BREAKOUT BTC/ETH BẰNG PYTHON + CCXT
Được viết bởi thanhdt vào ngày 27/11/2025 lúc 16:15 | 228 lượt xem

XÂY DỰNG BOT AUTO TRADING BREAKOUT BTC/ETH BẰNG PYTHON + CCXT
Chiến lược Breakout là một trong những phương pháp giao dịch phổ biến và hiệu quả nhất trong thị trường Crypto. Khi giá phá vỡ một vùng kháng cự/hỗ trợ mạnh, xác suất tiếp diễn xu hướng là rất cao.
Kết hợp chiến lược Breakout với Python & Binance API → chúng ta tạo ra bot auto trading breakout chạy tự động 24/7.
Bài này hướng dẫn xây dựng Bot Breakout cho BTC/ETH từ A → Z.
1. Breakout là gì? (Dành cho bot auto trading)
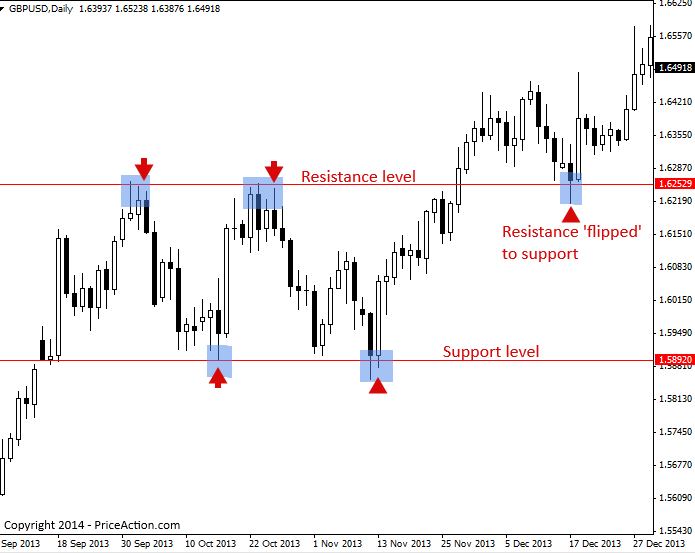

Breakout xảy ra khi:
- Giá vượt kháng cự → tín hiệu BUY
- Giá thủng hỗ trợ → tín hiệu SELL
Bot auto trading breakout sử dụng:
- Key Levels (vùng giá quan trọng)
- Highest High / Lowest Low
- Volume xác nhận (tùy chọn)
- Stop-loss bắt buộc để tránh fake breakout
2. Chuẩn bị môi trường bot auto trading Python
pip install ccxt
pip install pandas numpy
pip install python-dotenv
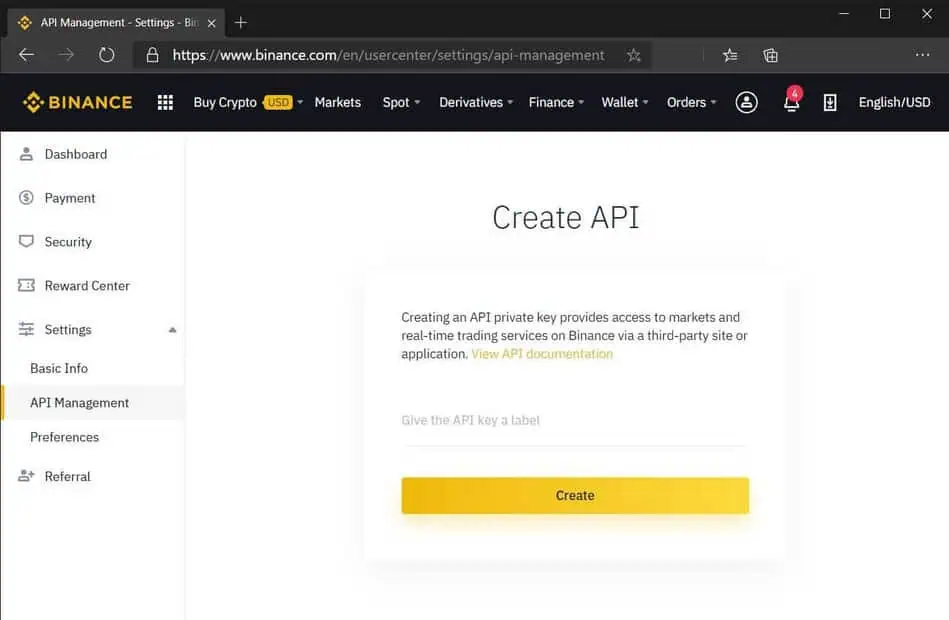
Tạo file .env:
BINANCE_API_KEY=xxxx
BINANCE_API_SECRET=xxxx
3. Lấy dữ liệu BTC/ETH bằng CCXT
import ccxt
import pandas as pd

binance = ccxt.binance({
    'options': {'defaultType': 'future'}
})

def fetch_klines(symbol="BTC/USDT", tf="5m", limit=200):
    ohlcv = binance.fetch_ohlcv(symbol, tf, limit=limit)
    df = pd.DataFrame(ohlcv, columns=["time","open","high","low","close","volume"])
    return df
4. Xác định Breakout Levels
Breakout zone = đỉnh gần nhất (kháng cự) hoặc đáy gần nhất (hỗ trợ)
def breakout_levels(df, length=20):
    high_level = df['high'].rolling(length).max().iloc[-2]
    low_level = df['low'].rolling(length).min().iloc[-2]
    return high_level, low_level
5. Tạo tín hiệu Breakout
def breakout_signal(df):
    high, low = breakout_levels(df)

    close = df['close'].iloc[-1]

    if close > high:
        return "BUY_BREAKOUT"

    if close < low:
        return "SELL_BREAKDOWN"

    return "NONE"
6. Gửi lệnh vào Binance Futures


from binance.client import Client
from dotenv import load_dotenv
import os

load_dotenv()
client = Client(os.getenv("BINANCE_API_KEY"), os.getenv("BINANCE_API_SECRET"))

def order(symbol, side, qty):
    return client.futures_create_order(
        symbol=symbol,
        side=side,
        type="MARKET",
        quantity=qty
    )
7. Chèn Stop-loss & Take-profit tự động
Chiến lược Breakout bắt buộc có SL do dễ gặp “breakout giả”.
BUY SL = đáy gần nhất
SELL SL = đỉnh gần nhất
8. Full code bot auto trading breakout (BTC/ETH)
import time

symbol = "BTCUSDT"
quantity = 0.01

while True:
    try:
        df = fetch_klines(symbol)
        sig = breakout_signal(df)
        high, low = breakout_levels(df)

        print("Signal:", sig)

        if sig == "BUY_BREAKOUT":
            order(symbol, "BUY", quantity)
            print("Breakout BUY executed at:", df['close'].iloc[-1])

        if sig == "SELL_BREAKDOWN":
            order(symbol, "SELL", quantity)
            print("Breakdown SELL executed at:", df['close'].iloc[-1])

    except Exception as e:
        print("Error:", e)

    time.sleep(8)  # delay 8 giây để tránh spam API
9. Nâng cấp Bot Auto Trading Breakout
Để bot thông minh hơn, có thể thêm:
✔ Volume Confirmation
Breakout chỉ hợp lệ khi volume tăng mạnh:
if df['volume'].iloc[-1] > df['volume'].rolling(20).mean().iloc[-1]:
    # volume ok
✔ ATR Stop-loss
Giúp bot chống quét SL:
df['ATR'] = df['high'] - df['low']
sl = df['close'].iloc[-1] - 1.5 * df['ATR'].iloc[-20]
✔ Avoid Fake Breakout
Chỉ BUY khi nến đóng trên kháng cự (Không dùng wick).
10. Chạy bot 24/7 bằng VPS

Ubuntu:
sudo apt update
sudo apt install python3-pip -y
nohup python3 breakout_bot.py &
Bài viết gần đây
-
Gia Công Bot Auto Trading | Case PyBot PyNhiQuaiBot 2026
Tháng 7 29, 2026 -
Bot Auto Trading XAUUSD MT5 | PyBot PyNhiQuaiBot Hedging Grid
Tháng 7 29, 2026
| XÂY DỰNG BOT AUTO TRADING MA6–10–20 CHO BINANCE FUTURES BẰNG PYTHON
Được viết bởi thanhdt vào ngày 27/11/2025 lúc 16:10 | 226 lượt xem

XÂY DỰNG BOT AUTO TRADING MA6–10–20 CHO BINANCE FUTURES BẰNG PYTHON
(Dành cho trader, lập trình viên và học viên Xu Hướng VIP)
Trong hệ thống Chiến Lược Xu Hướng VIP, bộ MA6–10–20 là một trong những công cụ mạnh mẽ nhất để xác định xu hướng, điểm vào lệnh và tín hiệu đảo chiều.
Khi kết hợp với Python và Binance API, chúng ta có thể biến nó thành bot auto trading chạy 24/7, theo đúng quy tắc đã học trong khóa.
Bài này sẽ hướng dẫn anh xây dựng bot auto trading Binance Futures MA6–10–20 đầy đủ từ A → Z.
1. Tổng quan chiến lược MA6–10–20 trong bot auto trading


Bộ MA6–10–20 tạo ra các tín hiệu:
1) Xu hướng tăng (Long Bias)
- MA6 cắt lên MA10
- MA10 nằm trên MA20
- Giá nằm trên MA6
2) Xu hướng giảm (Short Bias)
- MA6 cắt xuống MA10
- MA10 nằm dưới MA20
- Giá dưới MA6
3) Vùng nhiễu (Không giao dịch)
- MA6–10–20 bó hẹp
- MA phẳng – giá sideway
- Khối lượng giảm – market không trend
Bot auto trading sẽ chỉ vào lệnh khi xu hướng rõ ràng.
2. Chuẩn bị môi trường bot auto trading Python
pip install ccxt
pip install python-binance
pip install pandas numpy
pip install python-dotenv
Tạo file .env để bảo mật:
BINANCE_API_KEY=xxxx
BINANCE_API_SECRET=xxxx
3. Lấy dữ liệu Binance Futures bằng CCXT
import ccxt
import pandas as pd

binance = ccxt.binance({
    'options': {'defaultType': 'future'}
})

def get_data(pair="BTC/USDT", tf="5m", limit=200):
    ohlcv = binance.fetch_ohlcv(pair, tf, limit=limit)
    df = pd.DataFrame(ohlcv, columns=['time','open','high','low','close','volume'])
    return df
4. Tính MA6 – MA10 – MA20
def apply_ma(df):
    df['MA6'] = df['close'].rolling(6).mean()
    df['MA10'] = df['close'].rolling(10).mean()
    df['MA20'] = df['close'].rolling(20).mean()
    return df
5. Xác định tín hiệu MA6–10–20 cho bot auto trading
def get_signal(df):
    c = df.iloc[-1]

    if c['MA6'] > c['MA10'] and c['MA10'] > c['MA20'] and c['close'] > c['MA6']:
        return "LONG"

    if c['MA6'] < c['MA10'] and c['MA10'] < c['MA20'] and c['close'] < c['MA6']:
        return "SHORT"

    return "NONE"
6. Gửi lệnh Binance Futures (Long/Short)
from binance.client import Client
from dotenv import load_dotenv
import os

load_dotenv()
client = Client(os.getenv("BINANCE_API_KEY"), os.getenv("BINANCE_API_SECRET"))

def order_futures(symbol, side, qty):
    order = client.futures_create_order(
        symbol=symbol,
        type="MARKET",
        side=side,
        quantity=qty
    )
    return order
7. Kết hợp tất cả thành bot auto trading MA6–10–20
import time

symbol = "BTCUSDT"
qty = 0.01  # tùy tài khoản

while True:
    try:
        df = get_data(symbol)
        df = apply_ma(df)
        signal = get_signal(df)

        print("Signal:", signal)

        if signal == "LONG":
            order_futures(symbol, "BUY", qty)

        if signal == "SHORT":
            order_futures(symbol, "SELL", qty)

    except Exception as e:
        print("Error:", e)

    time.sleep(10)
8. Bổ sung quản trị rủi ro giống “Xu Hướng VIP”
Quy tắc chuẩn:
- Stop-loss đặt dưới MA20 (Long)
- Stop-loss đặt trên MA20 (Short)
- Không mở 2 vị thế cùng lúc
- Không giao dịch khi MA6–10–20 bó hẹp
- Không giao dịch khi volume giảm mạnh
9. Chạy bot auto trading 24/7 trên VPS


Trên Ubuntu:
sudo apt update
sudo apt install python3-pip
nohup python3 bot.py &
Kiểm tra log:
tail -f nohup.outBài viết gần đây
-
Gia Công Bot Auto Trading | Case PyBot PyNhiQuaiBot 2026
Tháng 7 29, 2026 -
Bot Auto Trading XAUUSD MT5 | PyBot PyNhiQuaiBot Hedging Grid
Tháng 7 29, 2026
| CÁCH XÂY DỰNG BOT AUTO TRADING BINANCE SPOT/FUTURES BẰNG PYTHON
Được viết bởi thanhdt vào ngày 27/11/2025 lúc 16:04 | 163 lượt xem

CÁCH XÂY DỰNG BOT AUTO TRADING BINANCE SPOT/FUTURES BẰNG PYTHON
(Kỹ thuật chuyên sâu cho trader & developer)
Bot Auto Trading trên Binance (Spot/Futures) là một trong những ứng dụng mạnh nhất của Python trong giao dịch tài chính. Để xây dựng một bot hiệu quả, bạn cần nắm rõ: API, xử lý dữ liệu, khung chiến lược, quản lý rủi ro, và cách vận hành trên VPS.
Bài viết này hướng dẫn đầy đủ từ A → Z.
1. Kiến trúc chuẩn của một Bot Auto Trading

Một bot chuẩn gồm 5 lớp:
1) Data Layer – Lấy dữ liệu thị trường
- Binance REST API
- Binance Websocket
- CCXT (thư viện Python đa sàn)
2) Indicator Layer – Tính toán tín hiệu
- MA, EMA, MACD, RSI
- ATR
- Mô hình nến
3) Strategy Layer – Thuật toán giao dịch
- Breakout
- Trend-following
- Long/Short Futures
- Grid Trading
- DCA
4) Risk Management – Quản trị rủi ro
- Stop-loss
- Take-profit
- Position size
- Max drawdown
5) Execution Layer – Gửi lệnh
- Market order
- Limit order
- Futures long/short
- Reduce-only
2. Chuẩn bị môi trường Python
pip install ccxt
pip install python-binance
pip install pandas numpy
pip install python-dotenv
Lời khuyên: Nên dùng Python 3.10.11 để tránh lỗi TA-Lib, pandas, numpy.
3. Lấy dữ liệu từ Binance (Spot & Futures)
3.1. Dữ liệu Spot bằng CCXT
import ccxt

binance = ccxt.binance()
ohlcv = binance.fetch_ohlcv('BTC/USDT', timeframe='1m', limit=100)
print(ohlcv[:3])
3.2. Dữ liệu Futures (USDT-M Futures)
binance_f = ccxt.binance({
    'options': { 'defaultType': 'future' }
})

data = binance_f.fetch_ohlcv('BTC/USDT', '5m', limit=200)
print(data[:3])
4. Tính MA, MACD, RSI bằng Python
import pandas as pd

df = pd.DataFrame(ohlcv, columns=['time','open','high','low','close','volume'])
df['MA20'] = df['close'].rolling(20).mean()
df['MA50'] = df['close'].rolling(50).mean()
MACD:
df['EMA12'] = df['close'].ewm(span=12).mean()
df['EMA26'] = df['close'].ewm(span=26).mean()
df['MACD'] = df['EMA12'] - df['EMA26']
df['Signal'] = df['MACD'].ewm(span=9).mean()
5. Xây chiến lược Trend Following (Spot/Futures)
Chiến lược MA20 cắt MA50:
BUY  khi MA20 > MA50 và giá trên MA20
SELL khi MA20 < MA50 và giá dưới MA20
Code:
if df['MA20'].iloc[-1] > df['MA50'].iloc[-1]:
    signal = "BUY"
else:
    signal = "SELL"

print("Signal:", signal)
6. Gửi lệnh SPOT bằng Binance API
from binance.client import Client
from dotenv import load_dotenv
import os

load_dotenv()

api_key = os.getenv("BINANCE_KEY")
api_secret = os.getenv("BINANCE_SECRET")

client = Client(api_key, api_secret)

order = client.order_market_buy(
    symbol='BTCUSDT',
    quantity=0.001
)

print(order)
7. Gửi lệnh FUTURES (Long/Short)
Lệnh Long Futures:
client.futures_create_order(
    symbol='BTCUSDT',
    side='BUY',
    type='MARKET',
    quantity=0.01
)
Lệnh Short Futures:
client.futures_create_order(
    symbol='BTCUSDT',
    side='SELL',
    type='MARKET',
    quantity=0.01
)
Lệnh đặt Stop-loss (Futures)
client.futures_create_order(
    symbol='BTCUSDT',
    side='SELL',
    type='STOP_MARKET',
    stopPrice=27000,
    closePosition=True
)
8. Thêm quản trị rủi ro (bắt buộc)
Winrate không quan trọng — Quan trọng là Risk/Reward
Quy tắc chuẩn:
- TP/SL ≥ 2:1
- Tối đa rủi ro mỗi lệnh: 1–2% tài khoản
- Mỗi chiến lược chỉ chạy 1 vị thế duy nhất
9. Chạy bot liên tục với vòng loop
import time

while True:
    try:
        # lấy data
        ohlcv = binance.fetch_ohlcv('BTC/USDT', '1m', limit=100)
        # tính toán
        # tạo tín hiệu
        # vào lệnh
    except Exception as e:
        print("Error:", e)

    time.sleep(10)
10. Deploy Bot lên VPS (Chạy 24/7)
Hướng dẫn nhanh:
- Thuê VPS (Ubuntu 22.04)
- Cài Python 3.10
- Upload bot qua SCP/Git
- Chạy bot bằng:
nohup python bot.py & - Kiểm tra log:
tail -f nohup.out
11. Bảo mật API Key đúng chuẩn
Không bao giờ ghi API trực tiếp vào code.
Dùng .env:
BINANCE_KEY=xxxx
BINANCE_SECRET=xxxx
KẾT LUẬN
Sau bài này, anh đã có đầy đủ:
- Kiến trúc bot
- Cách lấy dữ liệu Spot/Futures
- Indicator + chiến lược mẫu
- Cách gửi lệnh Spot & Futures
- Quản trị rủi ro
- Cách chạy bot 24/7
Bài viết gần đây
-
Gia Công Bot Auto Trading | Case PyBot PyNhiQuaiBot 2026
Tháng 7 29, 2026 -
Bot Auto Trading XAUUSD MT5 | PyBot PyNhiQuaiBot Hedging Grid
Tháng 7 29, 2026
| HƯỚNG DẪN CÀI PYTHON CHUẨN ĐỂ CODE BOT AUTO TRADING
Được viết bởi thanhdt vào ngày 27/11/2025 lúc 15:50 | 350 lượt xem

HƯỚNG DẪN CÀI PYTHON CHUẨN ĐỂ CODE BOT AUTO TRADING (CHUẨN SEO E-E-A-T)
Python là nền tảng quan trọng nhất để lập trình Bot Auto Trading cho Crypto, Forex, Chứng khoán. Để chạy ổn định, bạn cần cài đúng phiên bản, đúng PATH và đúng thư viện hỗ trợ Trading.
Bài viết này hướng dẫn chi tiết theo tiêu chuẩn E-E-A-T: đầy đủ – chính xác – thực chiến – có tính thẩm quyền.
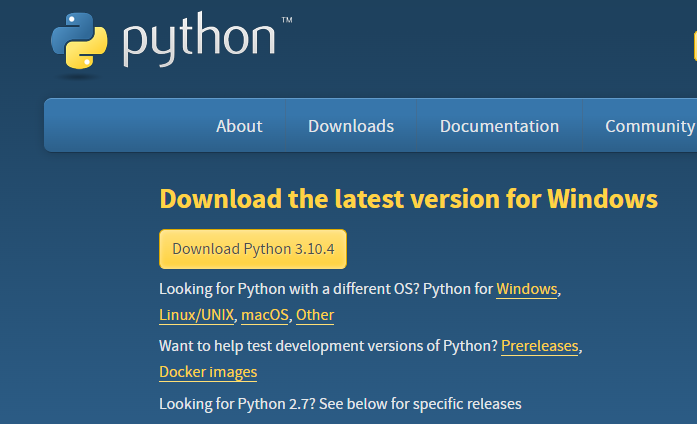
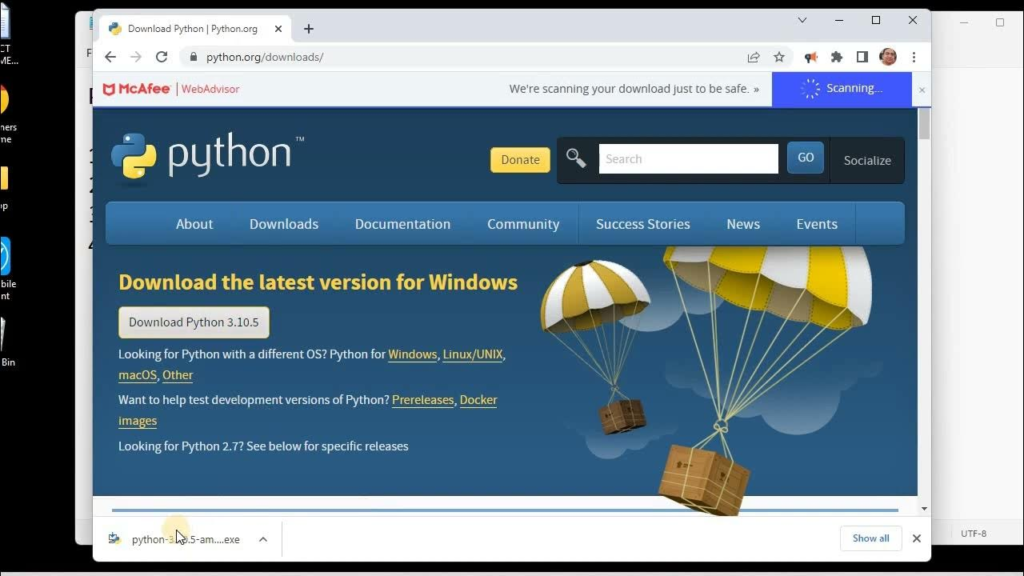
1. Tải đúng phiên bản Python dành cho Auto Trading
Khuyến nghị dùng Python 3.10.11 – phiên bản ổn định nhất cho:
- TA-Lib
- ccxt
- numpy, pandas
- MetaTrader5
Tải Python 3.10.11:
https://www.python.org/downloads/release/python-31011/
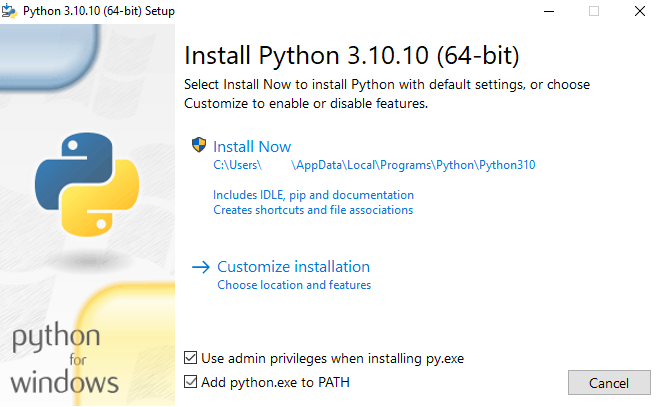
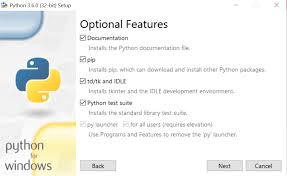
2. Cài Python đúng chuẩn
2.1. Tick “Add Python to PATH”
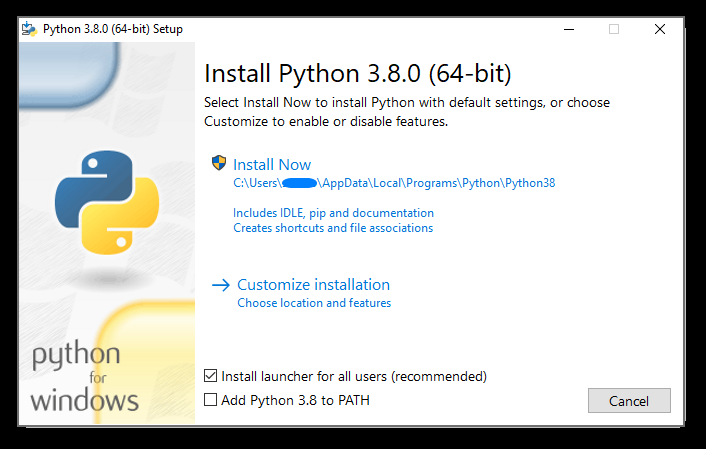
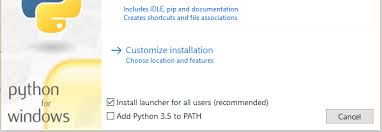
2.2. Chọn “Customize Installation”
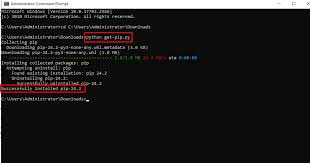
3. Kiểm tra sau khi cài đặt
python --version
pip --version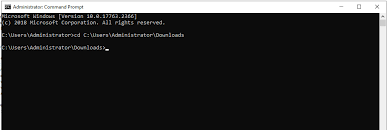
4. Tạo môi trường ảo (venv)
python -m venv bot-envKích hoạt:
bot-env\Scripts\activate5. Cài thư viện dành cho Bot Auto Trading
pip install pandas numpy
pip install ccxt
pip install MetaTrader5
TA-Lib WHL: https://www.lfd.uci.edu/~gohlke/pythonlibs/#ta-lib
6. Test Bot
import ccxt
binance = ccxt.binance()
data = binance.fetch_ohlcv('BTC/USDT', '1h', 5)
print(data)
7. Bộ lệnh chuẩn
python --version
pip install --upgrade pip
python -m venv bot-env
bot-env\Scripts\activate
pip install pandas numpy ccxt MetaTrader5 python-dotenv requests
8. E-E-A-T
- Experience: dựa trên thực chiến bot trading
- Expertise: Python 3.10 + TA-Lib + CCXT
- Authoritativeness: nguồn chính thống
- Trustworthiness: minh họa + hướng dẫn chi tiết
Bài viết gần đây
-
Gia Công Bot Auto Trading | Case PyBot PyNhiQuaiBot 2026
Tháng 7 29, 2026 -
Bot Auto Trading XAUUSD MT5 | PyBot PyNhiQuaiBot Hedging Grid
Tháng 7 29, 2026
| HƯỚNG DẪN GỠ CÀI ĐẶT PYTHON HOÀN TOÀN KHỎI WINDOWS
Được viết bởi thanhdt vào ngày 27/11/2025 lúc 15:33 | 448 lượt xem

HƯỚNG DẪN GỠ CÀI ĐẶT PYTHON HOÀN TOÀN KHỎI WINDOWS
(Khi gặp lỗi “Windows cannot find…”, lỗi 1618, hoặc mất file uninstall)
Nhiều trường hợp Python không thể gỡ khỏi Windows vì file uninstall trong thư mục Package Cache đã bị xóa hoặc Windows Installer đang bận. Điều này khiến hệ thống báo lỗi như:
- Windows cannot find python-3.xx-amd64.exe
- ReturnValue = 1618
- The feature you are trying to use is on a network resource that is unavailable
Dưới đây là hướng dẫn gỡ Python triệt để.
1. Gỡ bằng cách cài lại đúng phiên bản Python rồi uninstall
Đây là cách hiệu quả và an toàn nhất.
Bước 1: Tải lại đúng phiên bản Python mà Windows báo lỗi.
Ví dụ: Python 3.11.9
Tải tại: https://www.python.org/ftp/python/3.11.9/python-3.11.9-amd64.exe
Bước 2: Cài đặt lại bình thường.
Bước 3: Mở Settings > Apps > Python 3.11.9 > Uninstall
Lúc này file uninstall đã được phục hồi và gỡ bỏ thành công.
2. Gỡ bằng công cụ Microsoft Troubleshooter
Áp dụng khi uninstall bị hỏng hoặc mất file .exe.
Tải công cụ chính thức tại:
https://support.microsoft.com/en-us/topic/fix-problems-that-block-programs-from-being-installed-or-removed-542ebb1e-6f87-6f0c-df84-2c95c72b05ce
Mở công cụ và chọn:
- “Uninstalling”
- Chọn Python 3.x trong danh sách
- Chọn “Remove” để công cụ ép Windows xóa ứng dụng
3. Gỡ Python bằng WMIC (khi gặp ReturnValue = 1618)
Nếu lệnh WMIC báo ReturnValue = 1618, điều đó có nghĩa Windows Installer đang chạy tác vụ khác.
Bước 1: Mở Task Manager và tắt các tiến trình sau nếu có:
- msiexec.exe
- python.exe
- pip.exe
- IDLE
Bước 2: Mở CMD với quyền Administrator và chạy lệnh kiểm tra:
wmic product get name,version
Gỡ Python bằng lệnh:
wmic product where "name like 'Python 3.11%'" call uninstall /nointeractive
Hoặc:
wmic product where "name='Python 3.11.9 (64-bit)'" call uninstall /nointeractive
Nếu Windows Installer không bị kẹt, Python sẽ được gỡ.
4. Xóa Python thủ công (khi các cách trên không hoạt động)
Dùng khi hệ thống không còn file uninstall.
Xóa thư mục chương trình Python:
C:\Users\<TênUser>\AppData\Local\Programs\Python
Xóa các thư mục liên quan trong Package Cache:
C:\Users\<TênUser>\AppData\Local\Package Cache
Xóa alias Python trong WindowsApps:
C:\Users\<TênUser>\AppData\Local\Microsoft\WindowsApps
Xóa tất cả file liên quan python.exe, python3.exe, pip.exe.
Gỡ biến môi trường PATH:
- Mở “Edit the system environment variables”
- Chọn PATH
- Xóa tất cả các dòng như:
C:\Users\<User>\AppData\Local\Programs\Python\Python311\
C:\Users\<User>\AppData\Local\Programs\Python\Scripts\
5. Cài đặt lại Python phiên bản ổn định
Sau khi gỡ sạch Python, nên cài bản ổn định cho lập trình:
Phiên bản khuyến nghị: Python 3.10.11
Tải tại: https://www.python.org/downloads/release/python-31011/
Bài viết gần đây
-
Gia Công Bot Auto Trading | Case PyBot PyNhiQuaiBot 2026
Tháng 7 29, 2026 -
Bot Auto Trading XAUUSD MT5 | PyBot PyNhiQuaiBot Hedging Grid
Tháng 7 29, 2026
| Bitget ra mắt chiến dịch Golden Hearts: Hỗ trợ miền Trung kết hợp công nghệ blockchain
Được viết bởi thanhdt vào ngày 27/11/2025 lúc 09:55 | 244 lượt xem

Bitget ra mắt chiến dịch Golden Hearts: Hỗ trợ miền Trung kết hợp công nghệ blockchain
Miền Trung đang trải qua những khó khăn nghiêm trọng sau đợt bão lũ gần đây, ảnh hưởng lớn đến đời sống và tài sản của người dân. Trước tình hình này, Bitget triển khai chiến dịch cộng đồng Golden Hearts từ ngày 26/11 đến 9/12/2025, tạo ra một mô hình quyên góp minh bạch dựa trên blockchain, kết hợp với các kênh truyền thống, nhằm hỗ trợ trực tiếp những khu vực chịu thiệt hại.
Thông tin chi tiết và tiến độ chiến dịch được cập nhật trên các kênh chính thức của Bitget, bao gồm Facebook và Telegram, giúp cộng đồng theo dõi minh bạch và dễ dàng tham gia.
Blockchain và tính minh bạch trong mỗi khoản đóng góp
Chiến dịch Golden Hearts nhận donate thông qua địa chỉ ví BEP20, cho phép mọi giao dịch được theo dõi công khai trên chuỗi, đảm bảo tính minh bạch và chính xác. Song song với đó, đóng góp cũng có thể thực hiện thông qua tài khoản Ủy ban MTTQVN, đáp ứng nhu cầu của người dùng quen với hình thức truyền thống.
Địa chỉ ví BEP20 nhận donate:
0x4e380F961ce543BfC190Ba1EB9FB6071ebB7d44B
Toàn bộ số tiền trong ví BEP20 sẽ chỉ được tổng kết một lần sau ngày 9/12/2025, sau đó được đội ngũ Bitget Builders trao trực tiếp đến người dân miền Trung trước 25/12/2025.
Quà tặng cộng đồng: Merch và chứng nhận Golden Hearts


Người tham gia chương trình sau khi hoàn tất donate gửi transaction hash hoặc ảnh chụp màn hình cho Fanpage Bitget Vietnam sẽ nhận được danh sách quà tặng. Phần quà bao gồm các sản phẩm merch độc quyền và chứng nhận Golden Hearts, ghi nhận sự tham gia của cộng đồng vào hoạt động hỗ trợ. Với các khoản donate thông qua MTTQVN, quà tặng sẽ được gửi sau khi đơn vị này hoàn tất xác minh.
Công nghệ, pháp lý và danh mục tài sản mở rộng
Golden Hearts phản ánh cách Bitget vận hành các chương trình cộng đồng trong khuôn khổ khung pháp lý quốc tế. Nền tảng duy trì cơ chế tách biệt tài sản khách hàng và áp dụng các quy định AML/KYC đa tầng tại nhiều quốc gia châu Âu, bao gồm Ý, Ba Lan, Lithuania, Cộng hòa Séc và Georgia, giúp các hoạt động donate diễn ra minh bạch và an toàn. Tại Việt Nam, Bitget hoạt động theo mô hình không lưu ký VND và nạp – rút thông qua VietQR, phù hợp với quy định trong nước.
Ngoài hoạt động thiện nguyện, nền tảng còn mở rộng hệ sinh thái Universal Exchange (UEX) với danh mục tài sản đa dạng, bao gồm cổ phiếu Mỹ token hóa từ các công ty lớn như Apple, Tesla, Nvidia, Meta, Google và Amazon. Sự kết hợp giữa crypto và tài sản truyền thống tạo ra trải nghiệm đầu tư linh hoạt và minh bạch, đồng thời tăng niềm tin cho cộng đồng tham gia các chương trình như Golden Hearts.
Lan tỏa giá trị cộng đồng qua công nghệ
Chiến dịch Golden Hearts là minh chứng cho việc ứng dụng công nghệ blockchain trong các hoạt động xã hội, nâng cao tính minh bạch và hiệu quả. Mỗi khoản đóng góp không chỉ hỗ trợ người dân miền Trung sớm ổn định đời sống mà còn giới thiệu mô hình thiện nguyện hiện đại, kết hợp giữa công nghệ, pháp lý và cộng đồng.
Thông tin chi tiết về Bitget và các sản phẩm dịch vụ có thể truy cập tại Bitget Việt Nam
Giới thiệu về Bitget
Được thành lập vào năm 2018, Bitget là sàn giao dịch tiền điện tử và công ty Web3 hàng đầu thế giới. Phục vụ hơn 120 triệu người dùng ở 150+ quốc gia và khu vực, sàn giao dịch Bitget cam kết giúp người dùng giao dịch thông minh hơn với tính năng giao dịch sao chép tiên phong và các giải pháp giao dịch khác, đồng thời cung cấp quyền truy cập thời gian thực vào giá Bitcoin, giá Ethereum và giá của các loại tiền điện tử khác. Trước đây là BitKeep, Bitget Wallet là ví tiền điện tử phi lưu ký hàng đầu, hỗ trợ hơn 130 blockchain và hàng triệu token. Nền tảng cung cấp giao dịch đa chuỗi, staking, thanh toán và truy cập trực tiếp đến hơn 20.000 DApp, với tính năng hoán đổi nâng cao và thông tin chuyên sâu về thị trường được tích hợp trong một nền tảng duy nhất.
Bitget đang thúc đẩy chấp nhận tiền điện tử thông qua quan hệ đối tác chiến lược, chẳng hạn như vai trò là Đối tác tiền điện tử chính thức của Giải bóng đá hàng đầu thế giới, LALIGA, tại các thị trường Đông Âu, Đông Nam Á và Mỹ Latinh, cũng như đối tác toàn cầu của vận động viên Quốc gia Thổ Nhĩ Kỳ Buse Tosun Çavuşoğlu (Vô địch đấu vật thế giới), Samet Gümüş (Huy chương vàng quyền anh) và İlkin Aydın (Đội tuyển bóng chuyền quốc gia), để truyền cảm hứng cho cộng đồng toàn cầu nắm lấy tương lai tiền điện tử.
Phù hợp với chiến lược tác động toàn cầu của mình, Bitget đã hợp tác với UNICEF để hỗ trợ giáo dục blockchain cho 1,1 triệu người trước năm 2027. Trong thế giới đua xe thể thao, Bitget là đối tác sàn giao dịch tiền điện tử độc quyền của MotoGP™, một trong những giải vô địch hấp dẫn nhất thế giới.
Để biết thêm thông tin chi tiết, vui lòng truy cập: Website | X | Telegram | LinkedIn | Discord | Bitget Wallet
Đối với các yêu cầu về truyền thông, vui lòng liên hệ: media@bitget.com
Cảnh báo rủi ro: Giá tài sản kỹ thuật số có thể dao động và gặp biến động đáng kể. Các nhà đầu tư chỉ nên phân bổ số tiền mà họ có đủ khả năng để mất. Giá trị của bất kỳ khoản đầu tư nào cũng có thể bị ảnh hưởng và có khả năng các mục tiêu tài chính sẽ không được đáp ứng, cũng như số tiền đầu tư ban đầu sẽ không thể khôi phục. Hãy luôn tìm kiếm lời khuyên tài chính độc lập và cân nhắc kỹ lưỡng kinh nghiệm cũng như tình hình tài chính cá nhân. Hiệu suất trong quá khứ không phải là chỉ báo đáng tin cậy về hiệu suất trong tương lai. Bitget không chịu trách nhiệm cho bất kỳ tổn thất tiềm ẩn nào phát sinh. Không có nội dung nào trong tài liệu này nên được hiểu là lời khuyên tài chính. Để biết thêm thông tin, vui lòng tham khảo Điều khoản Sử dụng của chúng tôi.
Bài viết gần đây
-
Gia Công Bot Auto Trading | Case PyBot PyNhiQuaiBot 2026
Tháng 7 29, 2026 -
Bot Auto Trading XAUUSD MT5 | PyBot PyNhiQuaiBot Hedging Grid
Tháng 7 29, 2026
| Bitget Golden Hearts – Hướng về miền Trung sau bão lũ
Được viết bởi thanhdt vào ngày 27/11/2025 lúc 09:52 | 144 lượt xem

💛 Bitget Golden Hearts – Hướng về miền Trung sau bão lũ
Miền Trung vừa trải qua bão lũ nghiêm trọng, ảnh hưởng lớn đến đời sống và tài sản của người dân. Từ 26/11 đến 9/12/2025, chiến dịch Golden Hearts của Bitget mở ra cơ hội để cộng đồng chung tay hỗ trợ những người dân đang cần giúp đỡ.
Người tham gia nhận merch độc quyền và chứng nhận Golden Hearts, đồng thời có thể theo dõi toàn bộ thông tin và tiến độ chiến dịch minh bạch qua:
Facebook: https://www.facebook.com/share/p/16fbAV4WXc/
Telegram: https://t.me/bitgetvnthongbao/7479
Website Bitget: https://www.bitget.com/
Chiến dịch kết hợp công nghệ blockchain và quy trình minh bạch, giúp mọi đóng góp được theo dõi trực tuyến và đảm bảo đến đúng địa chỉ cần hỗ trợ.
Cùng Bitget lan tỏa yêu thương và hỗ trợ miền Trung! 💛🧡🩵
#GoldenHearts #HuongVeMienTrung #BitgetVietnam


Bài viết gần đây
-
Gia Công Bot Auto Trading | Case PyBot PyNhiQuaiBot 2026
Tháng 7 29, 2026 -
Bot Auto Trading XAUUSD MT5 | PyBot PyNhiQuaiBot Hedging Grid
Tháng 7 29, 2026
| Dữ Liệu Liên Tục vs. Không Liên Tục
Được viết bởi thanhdt vào ngày 26/11/2025 lúc 23:37 | 212 lượt xem

Dữ Liệu Liên Tục vs. Không Liên Tục
Tại Sao Quan Trọng Trong Phân Tích & Giao Dịch Định Lượng?
Video phân tích chi tiết:
Trong phân tích kỹ thuật và đặc biệt là giao dịch định lượng (Quantitative Trading), chất lượng dữ liệu quyết định trực tiếp độ chính xác của mô hình. Dữ liệu sai lệch hoặc không liên tục có thể khiến chiến lược vận hành kém hiệu quả, backtest ảo và đưa ra tín hiệu giao dịch sai.
1. Dữ liệu liên tục là gì?
Dữ liệu liên tục (Continuous Data) là dữ liệu được ghi nhận đều đặn theo thời gian, không có khoảng trống.
Ví dụ:
- Giá crypto chạy 24/7
- Dữ liệu Forex chạy 24/5
- Dữ liệu theo giây/phút trên thị trường phái sinh
Lợi ích khi sử dụng dữ liệu liên tục:
- Mô hình hóa xu hướng mượt hơn
- Tính toán chỉ báo (MA, ATR, RSI…) chính xác hơn
- Giảm nhiễu, giảm sai lệch tín hiệu
- Phù hợp cho mô hình Machine Learning
2. Dữ liệu không liên tục (Discontinuous Data)
Dữ liệu không liên tục xảy ra khi:
- Thị trường chứng khoán nghỉ cuối tuần, nghỉ lễ
- API sàn trả thiếu dữ liệu
- Server lưu trữ bị ngắt
- Bị mất nến trong quá trình thu thập
Hậu quả:
❌ Chỉ báo sai lệch
❌ Tín hiệu vào lệnh ảo
❌ Backtest không phản ánh thị trường thật
❌ Các mô hình ML bị nhiễu mạnh
3. Dữ liệu chứng khoán: Liên tục theo phiên – nhưng bị ngắt theo thời gian
Dữ liệu chứng khoán được xem là liên tục trong phiên giao dịch, nhưng bị gián đoạn:
- Qua đêm (overnight)
- Cuối tuần
- Dịp lễ
Điều này ảnh hưởng mạnh tới:
- Chiến lược Gap
- Breakout đầu phiên
- Volatility (độ biến động)
- Mô hình time-series
Do đó, khi xây dựng chiến lược định lượng, phải xử lý khoảng trống thời gian thay vì coi đó là nến bất thường.
4. Tại sao các hệ thống định lượng cần phân biệt dữ liệu?
Trong Quant Trading, chất lượng dữ liệu ảnh hưởng trực tiếp tới:
- Bot giao dịch
- Các mô hình Predictive Model
- Tính toán chỉ báo
- Risk Management
- Mô hình Machine Learning
Phân biệt dữ liệu liên tục & không liên tục giúp:
✅ Tránh sai lệch chỉ báo
✅ Chuẩn hóa dữ liệu trước khi training
✅ Tăng độ tin cậy của mô hình
✅ Giảm noise, tăng độ chính xác
5. Chọn phương pháp phân tích phù hợp với từng loại dữ liệu
| Loại dữ liệu | Phù hợp | Lưu ý |
|---|---|---|
| Liên tục (Crypto, Forex) | Trend-following, Momentum, ML, High-frequency | Giữ nguyên dạng raw để mô hình bắt nhịp tốt |
| Không liên tục (Stock) | Gap Strategy, Mean Reversion, Breakout phiên | Xử lý overnight gaps & missing candles |
Bổ sung chuyên sâu cho nhà giao dịch định lượng
Khi làm việc với dữ liệu không liên tục, nên thực hiện:
Forward FillhoặcInterpolationcho missing data- Chuẩn hóa thời gian (time alignment)
- Phân tách theo session nếu là chứng khoán
- Lưu cả dữ liệu thô (raw) và dữ liệu đã xử lý để so sánh
- Xác minh nguyên nhân thiếu nến (API lỗi hay thị trường nghỉ?)
Xem thêm phân tích giao dịch định lượng (Quant Trading)
https://www.huongnghiepdulieu.com/phan-tich-giao-dich-dinh-luong
Tại đây bạn sẽ học:
- Các kỹ thuật xử lý dữ liệu chuyên sâu
- Xây dựng bot giao dịch
- Backtest chuẩn xác, không ảo
- MA, MACD, RSI bằng Python
- Và nhiều chiến lược định lượng khác
Bài viết gần đây
-
Gia Công Bot Auto Trading | Case PyBot PyNhiQuaiBot 2026
Tháng 7 29, 2026 -
Bot Auto Trading XAUUSD MT5 | PyBot PyNhiQuaiBot Hedging Grid
Tháng 7 29, 2026
| Bitcoin đạt đỉnh lịch sử 123,000 USD
Được viết bởi thanhdt vào ngày 26/11/2025 lúc 19:26 | 275 lượt xem

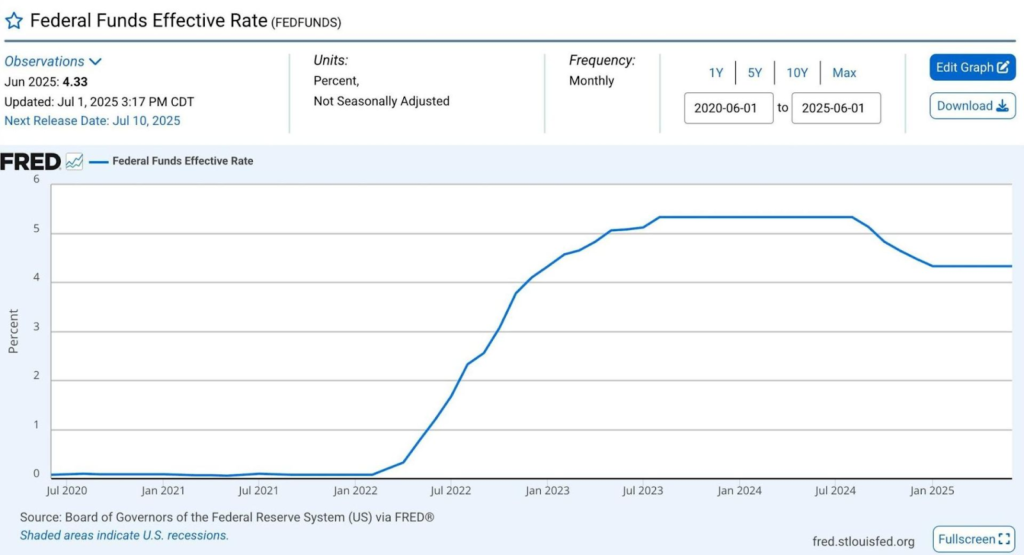
Bitcoin đạt đỉnh lịch sử 123,000 USD: Bối cảnh mới cho thị trường tài chính số toàn cầu
Bitcoin vừa ghi nhận mức giá khoảng 123,000 USD, mức cao nhất từ trước đến nay, đồng thời các chỉ số chứng khoán chủ chốt của Hoa Kỳ như S&P 500 và NASDAQ cũng thiết lập vùng đỉnh mới. Diễn biến này không chỉ tạo dấu ấn đối với nhà đầu tư tiền điện tử mà còn mở ra một giai đoạn mới, nơi tài sản số ngày càng gắn chặt với hệ sinh thái tài chính truyền thống.
Thông cáo này tổng hợp các yếu tố chính đang tạo nên đợt tăng tốc của Bitcoin, bao gồm diễn biến kỹ thuật trên thị trường phái sinh, xu hướng chính sách tại Hoa Kỳ và dòng vốn tổ chức thông qua Bitcoin ETF.

Short squeeze và làn sóng thanh lý vị thế
Một trong những chất xúc tác quan trọng của đợt tăng giá vừa qua đến từ hiện tượng short squeeze trên thị trường phái sinh. Khi một lượng lớn nhà giao dịch đặt vị thế bán khống (short) với kỳ vọng giá giảm, việc thị trường đảo chiều đi lên buộc các vị thế này phải đóng gấp bằng cách mua lại Bitcoin trong thời gian ngắn.
Trong một đợt biến động gần đây, hơn 200,000 tài khoản giao dịch đã bị thanh lý trong vòng 24 giờ, với tổng giá trị vị thế lên tới khoảng 1,06 tỷ USD. Áp lực mua cưỡng bức từ các lệnh đóng short đã kéo giá Bitcoin từ vùng dưới 110,000 USD lên xấp xỉ 116,000 USD chỉ trong vài giờ, tạo nền tảng cho cú bứt phá lên mức đỉnh 123,000 USD sau đó.

Hiện tượng này cho thấy thị trường Bitcoin ngày càng nhạy cảm với hoạt động phái sinh, khi đòn bẩy tài chính và thanh khoản hợp đồng tương lai có thể tạo ra những chuyển động giá dốc và nhanh hơn so với các chu kỳ trước.
Môi trường pháp lý Hoa Kỳ và vai trò của Nhà Trắng
Chính sách tại Hoa Kỳ tiếp tục là nhân tố có ảnh hưởng rộng đối với thị trường tiền điện tử toàn cầu. Lập trường ủng hộ tài sản số của Tổng thống Donald Trump đã tác động rõ rệt đến tâm lý nhà đầu tư và chiến lược của các tổ chức tài chính truyền thống.
Việc liên tục kêu gọi Cục Dự trữ Liên bang (Fed) giảm lãi suất tạo kỳ vọng về môi trường thanh khoản dồi dào hơn, chi phí vốn rẻ hơn và nhu cầu đa dạng hóa tài sản cao hơn, trong đó Bitcoin trở thành lựa chọn đáng chú ý. Mặc dù giai đoạn trước đó Fed từng nâng lãi suất khiến Bitcoin giảm về quanh 40,000 USD, tài sản này sau đó vẫn quay lại quỹ đạo tăng mạnh, vươn lên 123,000 USD, cho thấy vai trò ngày càng rõ nét của Bitcoin như một công cụ phòng ngừa lạm phát và biến động tiền tệ.
Bên cạnh chính sách tiền tệ, định hướng về thuế và pháp lý cũng tạo ra sự thay đổi quan trọng. Một quy định gây tranh luận của Sở Thuế vụ Hoa Kỳ (IRS) đối với các nền tảng DeFi đã được dỡ bỏ, qua đó giảm bớt rào cản đối với hoạt động giao dịch và xây dựng sản phẩm tài chính phi tập trung.
Quốc hội Hoa Kỳ cũng đang xem xét một gói dự luật chuyên biệt cho tài sản số, bao gồm các đề xuất như Đạo luật CLARITY, Đạo luật GENIUS và một đạo luật liên quan đến tiền kỹ thuật số ngân hàng trung ương (CBDC). Các dự luật này hướng tới mục tiêu làm rõ định nghĩa pháp lý, khung giám sát và giới hạn quyền can thiệp của mô hình CBDC đối với quyền riêng tư công dân.
Sự kết hợp giữa tín hiệu chính trị thuận lợi, định hướng thuế cởi mở hơn và nỗ lực xây dựng khung pháp lý rõ ràng đã tạo nền tảng cho niềm tin dài hạn đối với lĩnh vực tài sản số.
Dòng vốn tổ chức và cuộc đua Bitcoin ETF
Bước ngoặt lớn của chu kỳ hiện tại đến từ sự xuất hiện của các quỹ Bitcoin spot ETF được cơ quan quản lý Hoa Kỳ phê duyệt. Các tổ chức quản lý tài sản hàng đầu như BlackRock, Fidelity hay Bitwise đã lần lượt giới thiệu sản phẩm ETF, giúp nhà đầu tư tổ chức và cá nhân có thể tiếp cận Bitcoin thông qua các kênh quen thuộc trong tài chính truyền thống.
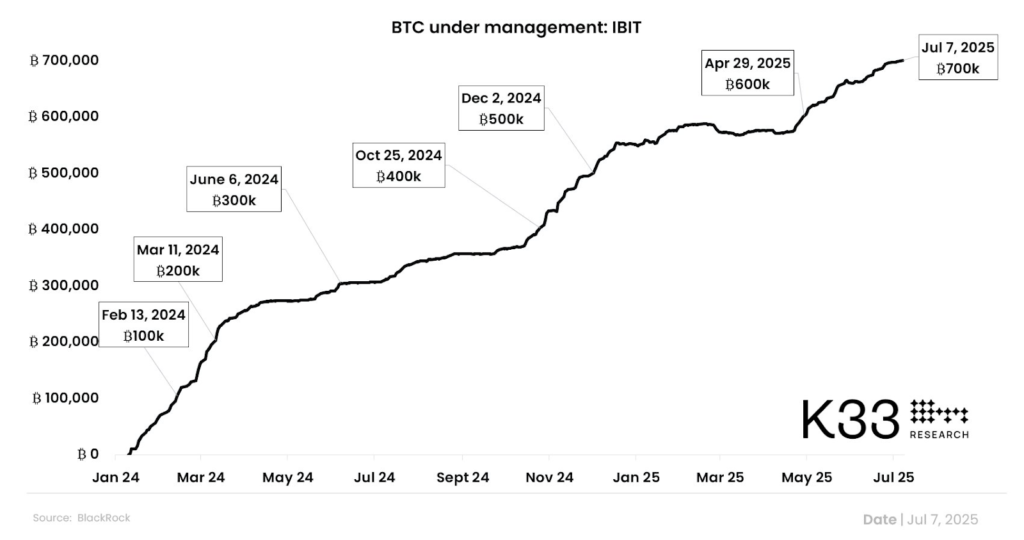
Quỹ IBIT của BlackRock nhanh chóng trở thành tâm điểm, với quy mô tài sản lên đến khoảng 80 tỷ USD, tương đương khoảng 700,000 BTC, và đang tiến gần mốc 100 tỷ USD. Đây là tốc độ tăng trưởng đáng kể nếu so với quỹ ETF vàng lớn nhất GLD, vốn mất trên một thập kỷ để đạt mức tương tự. Diễn biến này phản ánh nhu cầu tiếp cận Bitcoin của dòng vốn tổ chức ngày càng tăng.
Trong một giai đoạn giao dịch ngắn chỉ vài ngày, dữ liệu từ Farside ghi nhận các Bitcoin spot ETF tại Hoa Kỳ thu hút dòng vốn ròng khoảng 2,2 tỷ USD. Lượng mua ròng này tạo ra lực cầu bền vững, hỗ trợ giá Bitcoin duy trì trên vùng đỉnh mới.
Song song với ETF, các công ty niêm yết cũng gia tăng tích lũy Bitcoin. Theo thống kê của Bitwise, trong quý II, doanh nghiệp toàn cầu đã mua tổng cộng 159,107 BTC với giá trị khoảng 17 tỷ USD, tăng khoảng 60% so với quý trước.
Chỉ trong một khung thời gian ngắn, 35 công ty thuộc nhiều lĩnh vực khác nhau, từ công nghệ, truyền thông đến hạ tầng số, đã công bố mua khoảng 4,700 BTC. Tốc độ mua vào này thiết lập kỷ lục mới về quy mô tích lũy Bitcoin trong khoảng thời gian ngắn của khối doanh nghiệp.
Bài viết liên quan: Tuần lễ tiền điện tử tại Hoa Kỳ: Những điều bạn cần biết
Sự giao thoa giữa thị trường crypto và chứng khoán Hoa Kỳ
Việc Bitcoin đạt 123,000 USD diễn ra song song với việc các chỉ số chứng khoán Hoa Kỳ lập đỉnh mới. S&P 500 và NASDAQ ghi nhận mức giá cao kỷ lục trong bối cảnh nhà đầu tư tìm kiếm sự cân bằng giữa cổ phiếu tăng trưởng, tài sản phòng ngừa lạm phát và kênh đầu tư thay thế.
Sự song hành này cho thấy Bitcoin ngày càng vận hành như một phần của rổ tài sản toàn cầu, thay vì một thị trường tách biệt. Nhà đầu tư tổ chức có xu hướng phân bổ song song vào cổ phiếu công nghệ, quỹ ETF chỉ số và quỹ ETF Bitcoin, hình thành cấu trúc danh mục mới trong đó tài sản số giữ một tỷ trọng đáng kể.
Rủi ro, cơ hội và góc nhìn dài hạn
Đợt tăng giá lên 123,000 USD của Bitcoin là kết quả của nhiều tầng lớp yếu tố đan xen: kỹ thuật phái sinh, tâm lý nhà đầu tư, chính sách vĩ mô, khung pháp lý, ETF và hoạt động mua vào của doanh nghiệp.
Về dài hạn, nhiều tổ chức phân tích nhận định xu hướng mở rộng của Bitcoin vẫn còn dư địa, đặc biệt khi khung pháp lý tiếp tục được hoàn thiện, các sản phẩm tài chính liên quan đến Bitcoin ngày càng phong phú và thói quen nắm giữ tài sản số dần trở nên phổ biến trong danh mục của nhà đầu tư toàn cầu.
Tuy vậy, rủi ro biến động giá trong ngắn hạn luôn hiện hữu. Thị trường Bitcoin có thể trải qua các nhịp điều chỉnh sâu sau những giai đoạn tăng nóng, đặc biệt khi hoạt động chốt lời của các quỹ lớn và nhà giao dịch sử dụng đòn bẩy gia tăng. Việc phân bổ vốn hợp lý, quản trị rủi ro và tự nghiên cứu thông tin trước khi đầu tư tiếp tục là yêu cầu quan trọng.
Vai trò của Bitget trong bối cảnh thị trường mới
Là một trong các sàn giao dịch tài sản số hàng đầu, Bitget cung cấp hạ tầng giao dịch spot, futures, copy trade và các sản phẩm tài chính phái sinh liên quan đến Bitcoin, giúp nhà đầu tư tiếp cận thị trường ở nhiều cấp độ kinh nghiệm khác nhau.
Bên cạnh đó, hệ sinh thái Bitget còn bao gồm các công cụ phân tích, dữ liệu on-chain, sản phẩm quản lý tài sản và các chương trình giáo dục người dùng, hỗ trợ nhà đầu tư hiểu rõ hơn về cơ chế vận hành của Bitcoin, ETF và các lớp tài sản số khác.
Kết luận
Cột mốc 123,000 USD của Bitcoin không chỉ là một con số mới trên biểu đồ giá mà còn là dấu hiệu cho thấy tài sản số đang tiến sâu hơn vào trung tâm hệ thống tài chính toàn cầu.
Trong giai đoạn thị trường liên tục thiết lập các vùng giá chưa từng có, sự kết hợp giữa khung pháp lý rõ ràng hơn, dòng vốn tổ chức thông qua ETF, hoạt động tích lũy của doanh nghiệp và sự quan tâm ngày càng lớn từ nhà đầu tư cá nhân đã tạo nên một bối cảnh hoàn toàn khác so với các chu kỳ trước.
Bitcoin tiếp tục được theo dõi như một biến số quan trọng trong bức tranh tài chính mới, nơi ranh giới giữa tài sản truyền thống và tài sản số ngày càng mờ dần, còn sàn giao dịch như Bitget giữ vai trò cổng kết nối giúp nhà đầu tư bước vào kỷ nguyên tài chính số với đầy đủ công cụ giao dịch và quản trị rủi ro phù hợp.
Bài viết gần đây
-
Gia Công Bot Auto Trading | Case PyBot PyNhiQuaiBot 2026
Tháng 7 29, 2026 -
Bot Auto Trading XAUUSD MT5 | PyBot PyNhiQuaiBot Hedging Grid
Tháng 7 29, 2026
| BGB Trong Kỷ Nguyên PayFi & DeFi Toàn Cầu:
Được viết bởi thanhdt vào ngày 20/11/2025 lúc 11:50 | 163 lượt xem

BGB Trong Kỷ Nguyên PayFi & DeFi Toàn Cầu: Cơ Chế Giảm Phát Hoàn Thiện, Tiện Ích Mở Rộng và Hướng Tới Chuẩn Pháp Lý Mới
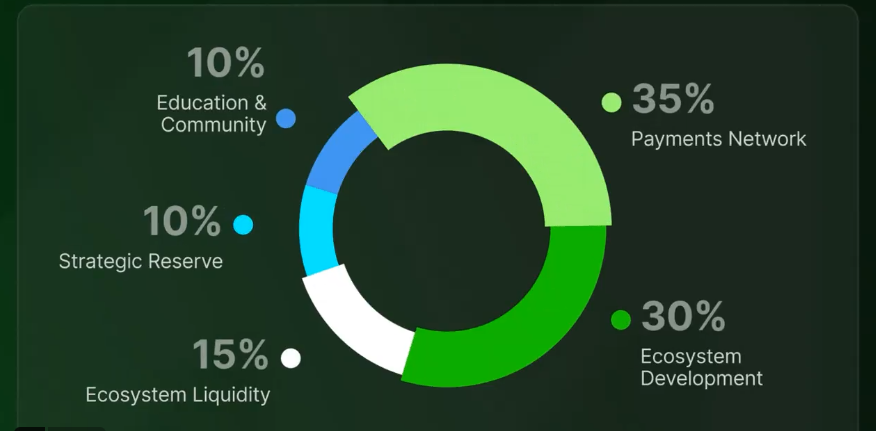
Sự kết hợp giữa Morph, Bitget và Bitget Wallet đang mở ra một giai đoạn phát triển hoàn toàn mới cho BGB. Không chỉ là token trung tâm của một sàn giao dịch, BGB đang tiến gần hơn đến vai trò nền tảng hạ tầng cho các dòng tiền onchain toàn cầu, gắn với PayFi, DeFi và hệ sinh thái thanh toán xuyên biên giới. Những thay đổi trong tokenomics, cơ chế burn dựa trên dữ liệu thực, sự mở rộng ứng dụng đa hệ sinh thái và định hướng tuân thủ pháp lý đang đặt BGB vào vị trí chiến lược giữa bối cảnh tài chính toàn cầu dịch chuyển mạnh về hướng blockchain hóa và tiêu chuẩn hóa.
1. Thị trường toàn cầu thay đổi: Token hoá tài sản, cổ phiếu Mỹ và bước tiến pháp lý
Trong vài năm gần đây, tài sản số đang chuyển dịch khỏi mô hình thuần đầu cơ sang các cấu trúc PayFi – kết hợp thanh toán, tài chính và hạ tầng onchain. Các loại tài sản truyền thống, đặc biệt là cổ phiếu Mỹ, ngày càng được đưa lên blockchain thông qua mô hình token hóa.
Những mã cổ phiếu quen thuộc như Apple, Tesla, Amazon, LLY, MA hay UNH đã xuất hiện dưới dạng token có thể giao dịch 24/7, giúp người dùng toàn cầu tiếp cận thị trường chứng khoán Mỹ mà không bị giới hạn bởi múi giờ hay rào cản kỹ thuật. Bitget nằm trong số những đơn vị tiên phong triển khai giao dịch cổ phiếu Mỹ token hóa theo mô hình 1:1 với dữ liệu giá gốc, tạo nên một lớp tài sản nằm giữa offchain và onchain, hỗ trợ đắc lực cho giao dịch xuyên biên giới.
Khi các hoạt động thanh toán và luân chuyển giá trị toàn cầu ngày càng có xu hướng đi lên blockchain, thị trường bắt đầu cần một tài sản trung gian bền vững, có tiện ích thực tế và khả năng mở rộng trên nhiều hệ sinh thái. BGB đang được phát triển để đảm nhiệm vai trò này trong hệ sinh thái Morph cũng như mạng lưới đối tác thanh toán – từ sàn giao dịch, ví, giao thức DeFi cho tới các nền tảng PayFi.
Về mặt pháp lý, Bitget hiện sở hữu hệ thống giấy phép toàn cầu bao gồm: đăng ký tại Seychelles, giấy phép kinh doanh tài sản số tại Ba Lan, Lithuania, Cộng hòa Séc, Bulgaria, Ý, Georgia và Argentina, đồng thời tuân thủ các chuẩn AML/KYC theo khung MiCA của châu Âu. Mô hình Universal Exchange (UEX) của Bitget được thiết kế để đáp ứng yêu cầu minh bạch quốc tế: Bằng chứng dự trữ PoR > 200%, Quỹ Bảo Vệ trị giá hơn 700 triệu USD và chuẩn bảo mật cấp ngân hàng. Tại Việt Nam, Bitget nằm trong nhóm các sàn giao dịch được cộng đồng đánh giá cao về tính pháp lý khi thị trường đang chuẩn bị triển khai cơ chế thí điểm cho tài sản số; Bitget cũng được xem là ứng viên phù hợp nhờ hồ sơ tuân thủ, hệ thống KYC mạnh và khả năng tích hợp pháp lý sở tại khi khung quản lý chính thức được ban hành.
2. Nâng cấp tokenomics: Cơ chế burn dựa trên dữ liệu thật và mô hình kiểm chứng onchain
Bước ngoặt quan trọng trong tokenomics của BGB đến từ quyết định chuyển 440 triệu BGB sang Morph Foundation và đốt ngay 220 triệu, đưa đường cong giảm phát tiến nhanh hơn hơn bảy quý so với kế hoạch ban đầu. Đây là nền tảng để triển khai cơ chế burn mới – minh bạch, tự động và gắn chặt với hiệu suất thực tế của hệ sinh thái Morph.
Khác với các mô hình công bố trước một con số đốt cố định, cơ chế mới của BGB không đưa ra cam kết “burn bao nhiêu mỗi tháng/quý”. Lượng BGB bị đốt hoàn toàn phụ thuộc vào phí (Fees) mà hệ sinh thái Morph tạo ra. Điều này có vài điểm then chốt:
- Không thể đưa ra con số cố định: Mọi “range” nội bộ chỉ mang tính mô phỏng kịch bản, nếu công khai như cam kết sẽ dễ bị hiểu sai là bảo đảm lợi nhuận.
- Burn tăng theo quy mô thật của mạng lưới: Phí hệ sinh thái càng lớn, khối lượng BGB bị đốt càng cao.
- Các kịch bản 6–8 năm chỉ là ví dụ: Một số mô hình cho thấy nếu phí đạt đến quy mô hàng trăm triệu USD mỗi năm, nguồn cung BGB có thể tiến sát mức 100 triệu trong khoảng 6–8 năm. Tuy nhiên, đây chỉ là minh họa cách cơ chế vận hành, không phải dự báo chính thức hay cam kết.
Ở giai đoạn đầu, khi hệ sinh thái còn nhỏ, mức phí tự nhiên sẽ thấp – điều hoàn toàn bình thường với bất kỳ mạng lưới mới nào. Để tránh cảm giác “burn quá yếu”, cơ chế mới bổ sung hệ số Booster, giúp gia tăng cường độ giảm phát trong giai đoạn sớm. Cùng với đó, cú đốt một lần 220 triệu BGB trước đó đã đẩy nhanh đáng kể tiến trình giảm phát tổng thể.
3. Công thức burn BGB: Minh bạch, kiểm chứng và tránh mọi dạng “cam kết lợi nhuận”
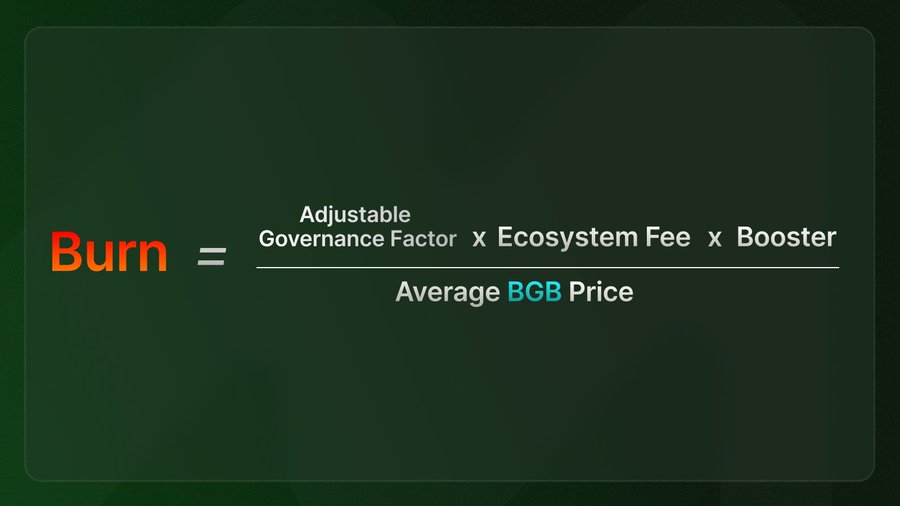
Cơ chế burn mới của BGB được xây dựng xoay quanh bốn thành phần chính:
- Tổng phí hệ sinh thái Morph sau khi trừ phí layer-1;
- Giá BGB trung bình theo TWAP để tránh biến động ngắn hạn;
- Chỉ số Governance Factor phản ánh quyết định cộng đồng;
- Hệ số Booster giúp điều chỉnh cường độ burn, đặc biệt trong giai đoạn đầu.
Cấu trúc này giúp hệ thống vận hành theo hướng:
- Không có con số “đốt cứng” được công bố từ trước, tránh mọi diễn giải liên quan đến việc hứa hẹn lợi nhuận.
- Mọi dữ liệu đầu vào (phí, giá, tham số) đều có thể kiểm chứng onchain hoặc từ nguồn dữ liệu thị trường công khai.
- Khi hoạt động của mạng lưới tăng, phí tích lũy tăng và lượng burn tự động mở rộng theo từng chu kỳ.
Trong ngắn hạn, biến động giá BGB vẫn chịu ảnh hưởng chủ yếu bởi tâm lý thị trường. Ngay cả đội ngũ phát triển cũng nhấn mạnh rằng cơ chế burn mới không phải “biện pháp giải cứu giá”, mà là công cụ xây dựng nền tảng giá trị dài hạn. Nếu mục tiêu chỉ là tác động giá ngắn hạn, việc công bố một con số burn cố định sẽ đơn giản hơn rất nhiều so với việc thiết kế cả một công thức phức tạp gắn với dữ liệu thật và ràng buộc pháp lý.
4. Kho bạc Morph Foundation: Minh bạch tuyệt đối và giới hạn sử dụng hợp lý
Với bản nâng cấp Viridian và sự hỗ trợ của EIP-7702, BGB trở thành một trong những token ERC-20 đầu tiên có thể thanh toán phí gas trực tiếp trên Morph. Điều này đánh dấu bước dịch chuyển chiến lược:
- BGB không chỉ là token giao dịch phí sàn, mà trở thành tài sản hạ tầng cho cả mạng lưới;
- Người dùng có thể nắm giữ BGB để thanh toán gas, sử dụng dApp, tham gia các hoạt động PayFi, thay vì phải chuyển đổi qua nhiều token trung gian.
Bên cạnh vai trò gas, BGB còn là:
- Token quản trị (governance), dùng để tham gia vào các quyết định chiến lược của mạng lưới;
- Tài sản settlement, đứng giữa stablecoin và hệ sinh thái đối tác;
- Cầu nối giá trị giữa các ứng dụng: từ sàn giao dịch Bitget, Bitget Wallet đến các giao thức DeFi và PayFi.
Nhiều dApp phụ thuộc BGB (BGB-dependent dApps) đang trong giai đoạn tích hợp và thử nghiệm. Thay vì chạy theo các chương trình DeFi lãi suất cao ngắn hạn, đội ngũ phát triển lựa chọn triển khai tiện ích DeFi theo từng bước, ưu tiên các sản phẩm có ứng dụng thực tế, hạn chế “over-financialization” chỉ để tăng TVL ảo.
5. Quản trị và minh bạch onchain: BGB holder trở thành trung tâm
Một trong những điểm khác biệt của cơ chế mới là Governance Factor – tham số được thiết kế để gắn kết quyền quyết định của cộng đồng với cách thức vận hành burn.
- Ở giai đoạn đầu, Morph Foundation sẽ đặt ra giá trị và khoảng giá trị (range) của Governance Factor, đồng thời công bố công khai lý do lựa chọn.
- Khi nền tảng quản trị (governance platform) đi vào hoạt động, BGB holders trên Morph sẽ có thể tham gia bỏ phiếu, từng bước chuyển giao quyền quyết định từ Foundation sang cộng đồng.
Lộ trình dự kiến của giai đoạn 1 quản trị sẽ được mở dần trong giai đoạn 2025–2026, cho phép tất cả người nắm giữ BGB trên Morph tham gia.
Trong ngắn hạn, cộng đồng có thể kiểm chứng kết quả hoạt động của cơ chế burn thông qua các đầu mục rõ ràng sau mỗi chu kỳ:
- Số liệu Ecosystem Fee theo quý;
- Các tham số trong công thức;
- Lượng BGB được burn;
- Giao dịch burn trên chuỗi, kèm theo explorer link.
Tất cả sẽ được công bố để người dùng có thể tự kiểm tra, kết nối từng bước: Phí → Tham số → Lượng burn → Giao dịch onchain.
6. Mở rộng DeFi: Gia tăng tiện ích và giảm áp lực cung
BGB đang trở thành tài sản trung tâm của nhiều giao thức quan trọng trong hệ sinh thái Morph như lending, collateral, staking và các mô hình yield dựa trên giá trị thực. Morph Foundation ưu tiên hỗ trợ các builder phát triển sản phẩm có ứng dụng thực thay vì đẩy TVL ảo – điều thường thấy ở nhiều hệ sinh thái khác.
Khi người dùng khóa BGB vào các giao thức DeFi để nhận lợi ích, một phần nguồn cung lưu hành được tạm thời hấp thụ, từ đó giảm áp lực bán. Đồng thời, khi hoạt động giao thức tăng, phí tích lũy tăng và lượng burn mỗi kỳ cũng tự động mở rộng.
7. PayFi và thị trường thanh toán 3 nghìn tỷ USD: BGB giữ vai trò trung tâm
Thị trường thanh toán toàn cầu được dự báo vượt ba nghìn tỷ USD trong vài năm tới, lớn hơn nhiều lần so với quy mô hiện tại của thị trường crypto. Morph định vị mình như một hạ tầng PayFi – nghĩa là sử dụng blockchain để hỗ trợ thanh toán, thương mại và dòng tiền thực, chứ không chỉ tập trung vào giao dịch tài sản số.
Trong mô hình này, BGB được đặt ở vị trí trung tâm, vừa là token khuyến khích thanh toán, vừa là tài sản dành cho thương nhân, vừa đóng vai trò incentive cho người dùng mới và cũng là tài sản dùng để settlement giữa các stablecoin và đối tác thanh toán. Điều này mở cho BGB khả năng tiếp cận hàng tỷ người dùng trong hệ sinh thái thanh toán toàn cầu, thay vì chỉ giới hạn trong cộng đồng crypto truyền thống.
8. Pháp lý toàn cầu và cơ hội cho các token có tính minh bạch cao
Các thị trường lớn như Mỹ, EU, Singapore và Hồng Kông đang hướng tới chuẩn hóa quản lý stablecoin, tài sản số và hoạt động token hóa. Xu hướng chung là yêu cầu minh bạch dữ liệu, cơ chế burn kiểm chứng, quản trị onchain rõ ràng và phân loại token dựa trên mức độ tiện ích.
Tại Việt Nam, các cơ quan quản lý đang nghiên cứu sandbox fintech, thí điểm công nghệ blockchain và giám sát chặt chẽ các tổ chức cung cấp dịch vụ tài sản số. Những định hướng như phòng chống rửa tiền, quản trị minh bạch và công bố dữ liệu đều phù hợp với mô hình vận hành của BGB hiện nay. Điều này giúp BGB trở thành một trong những token có khả năng thích ứng tốt khi luật hóa diễn ra mạnh hơn trong vài năm tới.
9. Niêm yết toàn cầu và mở rộng hệ sinh thái
Để tăng thanh khoản và mức độ nhận diện, BGB đang tiếp tục được thúc đẩy niêm yết trên nhiều sàn giao dịch quốc tế. Song song với đó, hệ sinh thái mở của Morph cho phép ví, nền tảng thanh toán, các sàn và cổng thương nhân tích hợp BGB trực tiếp như một tài sản có giá trị sử dụng.
Hệ sinh thái càng mở rộng, nhu cầu sử dụng BGB càng lớn và cơ chế giảm phát càng được kích hoạt mạnh hơn theo từng chu kỳ hoạt động.
10. Tầm nhìn dài hạn: BGB trở thành xương sống của PayFi – DeFi – Real-World Value Movement
Tương lai của BGB được xây dựng trên sự kết hợp giữa tokenomics giảm phát bền vững, governance phân quyền, tiện ích đa hệ sinh thái và khả năng thích ứng với yêu cầu pháp lý toàn cầu. Khi PayFi, thanh toán và tài sản thực ngày càng chuyển dịch sang mô hình onchain, nhu cầu về một token hạ tầng, minh bạch và có cơ chế vận hành tự gia tốc sẽ tăng mạnh.
Với sự đồng hành của Morph, Bitget và các đối tác quốc tế, BGB đang tiến gần tới vai trò trở thành xương sống của nền kinh tế onchain – nơi dòng tiền thực, tài sản thực và dịch vụ tài chính toàn cầu giao nhau trên một hạ tầng minh bạch và bền vững.
Giới thiệu về Bitget
Được thành lập vào năm 2018, Bitget là sàn giao dịch tiền điện tử và công ty Web3 hàng đầu thế giới. Phục vụ hơn 120 triệu người dùng ở 150+ quốc gia và khu vực, sàn giao dịch Bitget cam kết giúp người dùng giao dịch thông minh hơn với tính năng giao dịch sao chép tiên phong và các giải pháp giao dịch khác, đồng thời cung cấp quyền truy cập thời gian thực vào giá Bitcoin, giá Ethereum và giá của các loại tiền điện tử khác. Trước đây là BitKeep, Bitget Wallet là ví tiền điện tử phi lưu ký hàng đầu, hỗ trợ hơn 130 blockchain và hàng triệu token. Nền tảng cung cấp giao dịch đa chuỗi, staking, thanh toán và truy cập trực tiếp đến hơn 20.000 DApp, với tính năng hoán đổi nâng cao và thông tin chuyên sâu về thị trường được tích hợp trong một nền tảng duy nhất.
Bitget đang thúc đẩy chấp nhận tiền điện tử thông qua quan hệ đối tác chiến lược, chẳng hạn như vai trò là Đối tác tiền điện tử chính thức của Giải bóng đá hàng đầu thế giới, LALIGA, tại các thị trường Đông Âu, Đông Nam Á và Mỹ Latinh, cũng như đối tác toàn cầu của vận động viên Quốc gia Thổ Nhĩ Kỳ Buse Tosun Çavuşoğlu (Vô địch đấu vật thế giới), Samet Gümüş (Huy chương vàng quyền anh) và İlkin Aydın (Đội tuyển bóng chuyền quốc gia), để truyền cảm hứng cho cộng đồng toàn cầu nắm lấy tương lai tiền điện tử.
Phù hợp với chiến lược tác động toàn cầu của mình, Bitget đã hợp tác với UNICEF để hỗ trợ giáo dục blockchain cho 1,1 triệu người trước năm 2027. Trong thế giới đua xe thể thao, Bitget là đối tác sàn giao dịch tiền điện tử độc quyền của MotoGP™, một trong những giải vô địch hấp dẫn nhất thế giới.
Để biết thêm thông tin chi tiết, vui lòng truy cập: Website | X | Telegram | LinkedIn | Discord | Bitget Wallet
Đối với các yêu cầu về truyền thông, vui lòng liên hệ: media@bitget.com
Cảnh báo rủi ro: Giá tài sản kỹ thuật số có thể dao động và gặp biến động đáng kể. Các nhà đầu tư chỉ nên phân bổ số tiền mà họ có đủ khả năng để mất. Giá trị của bất kỳ khoản đầu tư nào cũng có thể bị ảnh hưởng và có khả năng các mục tiêu tài chính sẽ không được đáp ứng, cũng như số tiền đầu tư ban đầu sẽ không thể khôi phục. Hãy luôn tìm kiếm lời khuyên tài chính độc lập và cân nhắc kỹ lưỡng kinh nghiệm cũng như tình hình tài chính cá nhân. Hiệu suất trong quá khứ không phải là chỉ báo đáng tin cậy về hiệu suất trong tương lai. Bitget không chịu trách nhiệm cho bất kỳ tổn thất tiềm ẩn nào phát sinh. Không có nội dung nào trong tài liệu này nên được hiểu là lời khuyên tài chính. Để biết thêm thông tin, vui lòng tham khảo Điều khoản Sử dụng của chúng tôi.